Survey Results
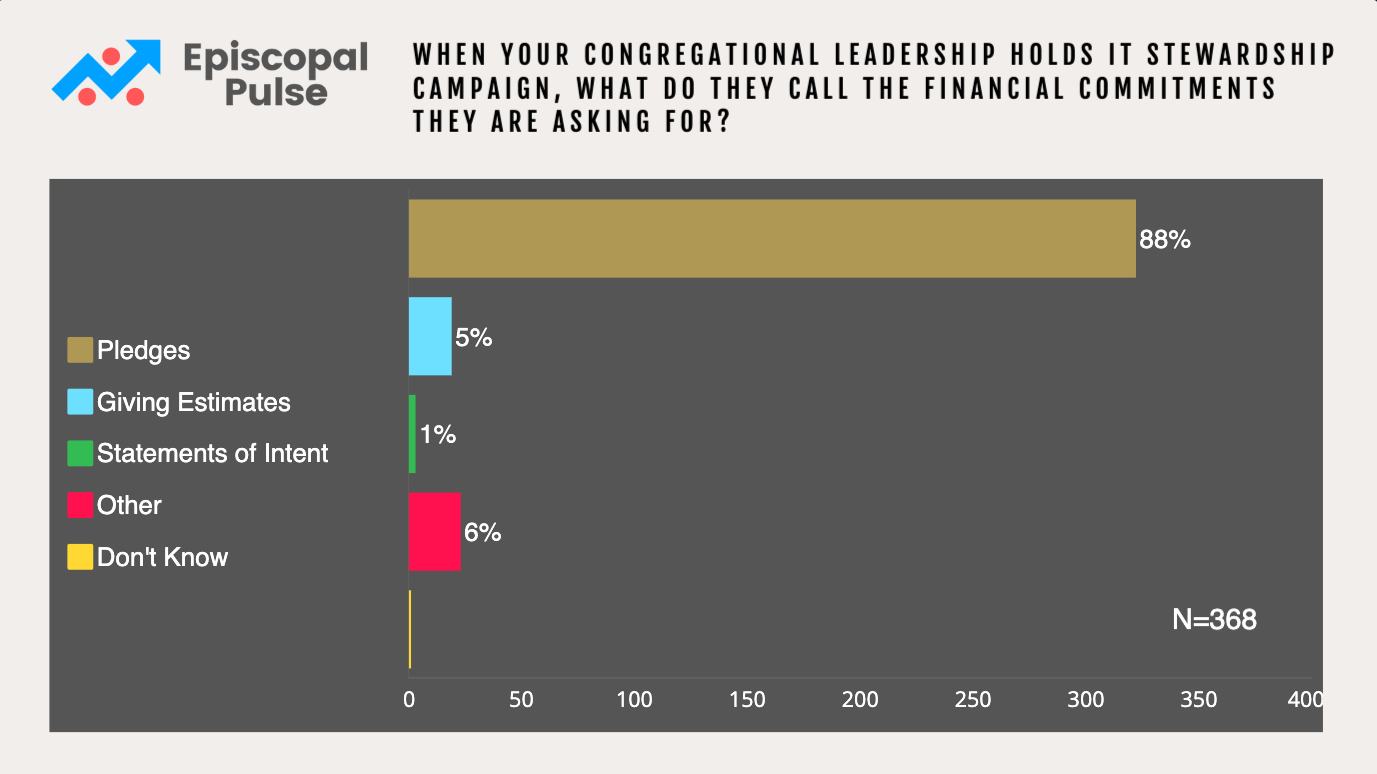
Survey 36: Stewardship Campaign
Survey 35: Campus Ministry
Does your congregation have a campus ministry?
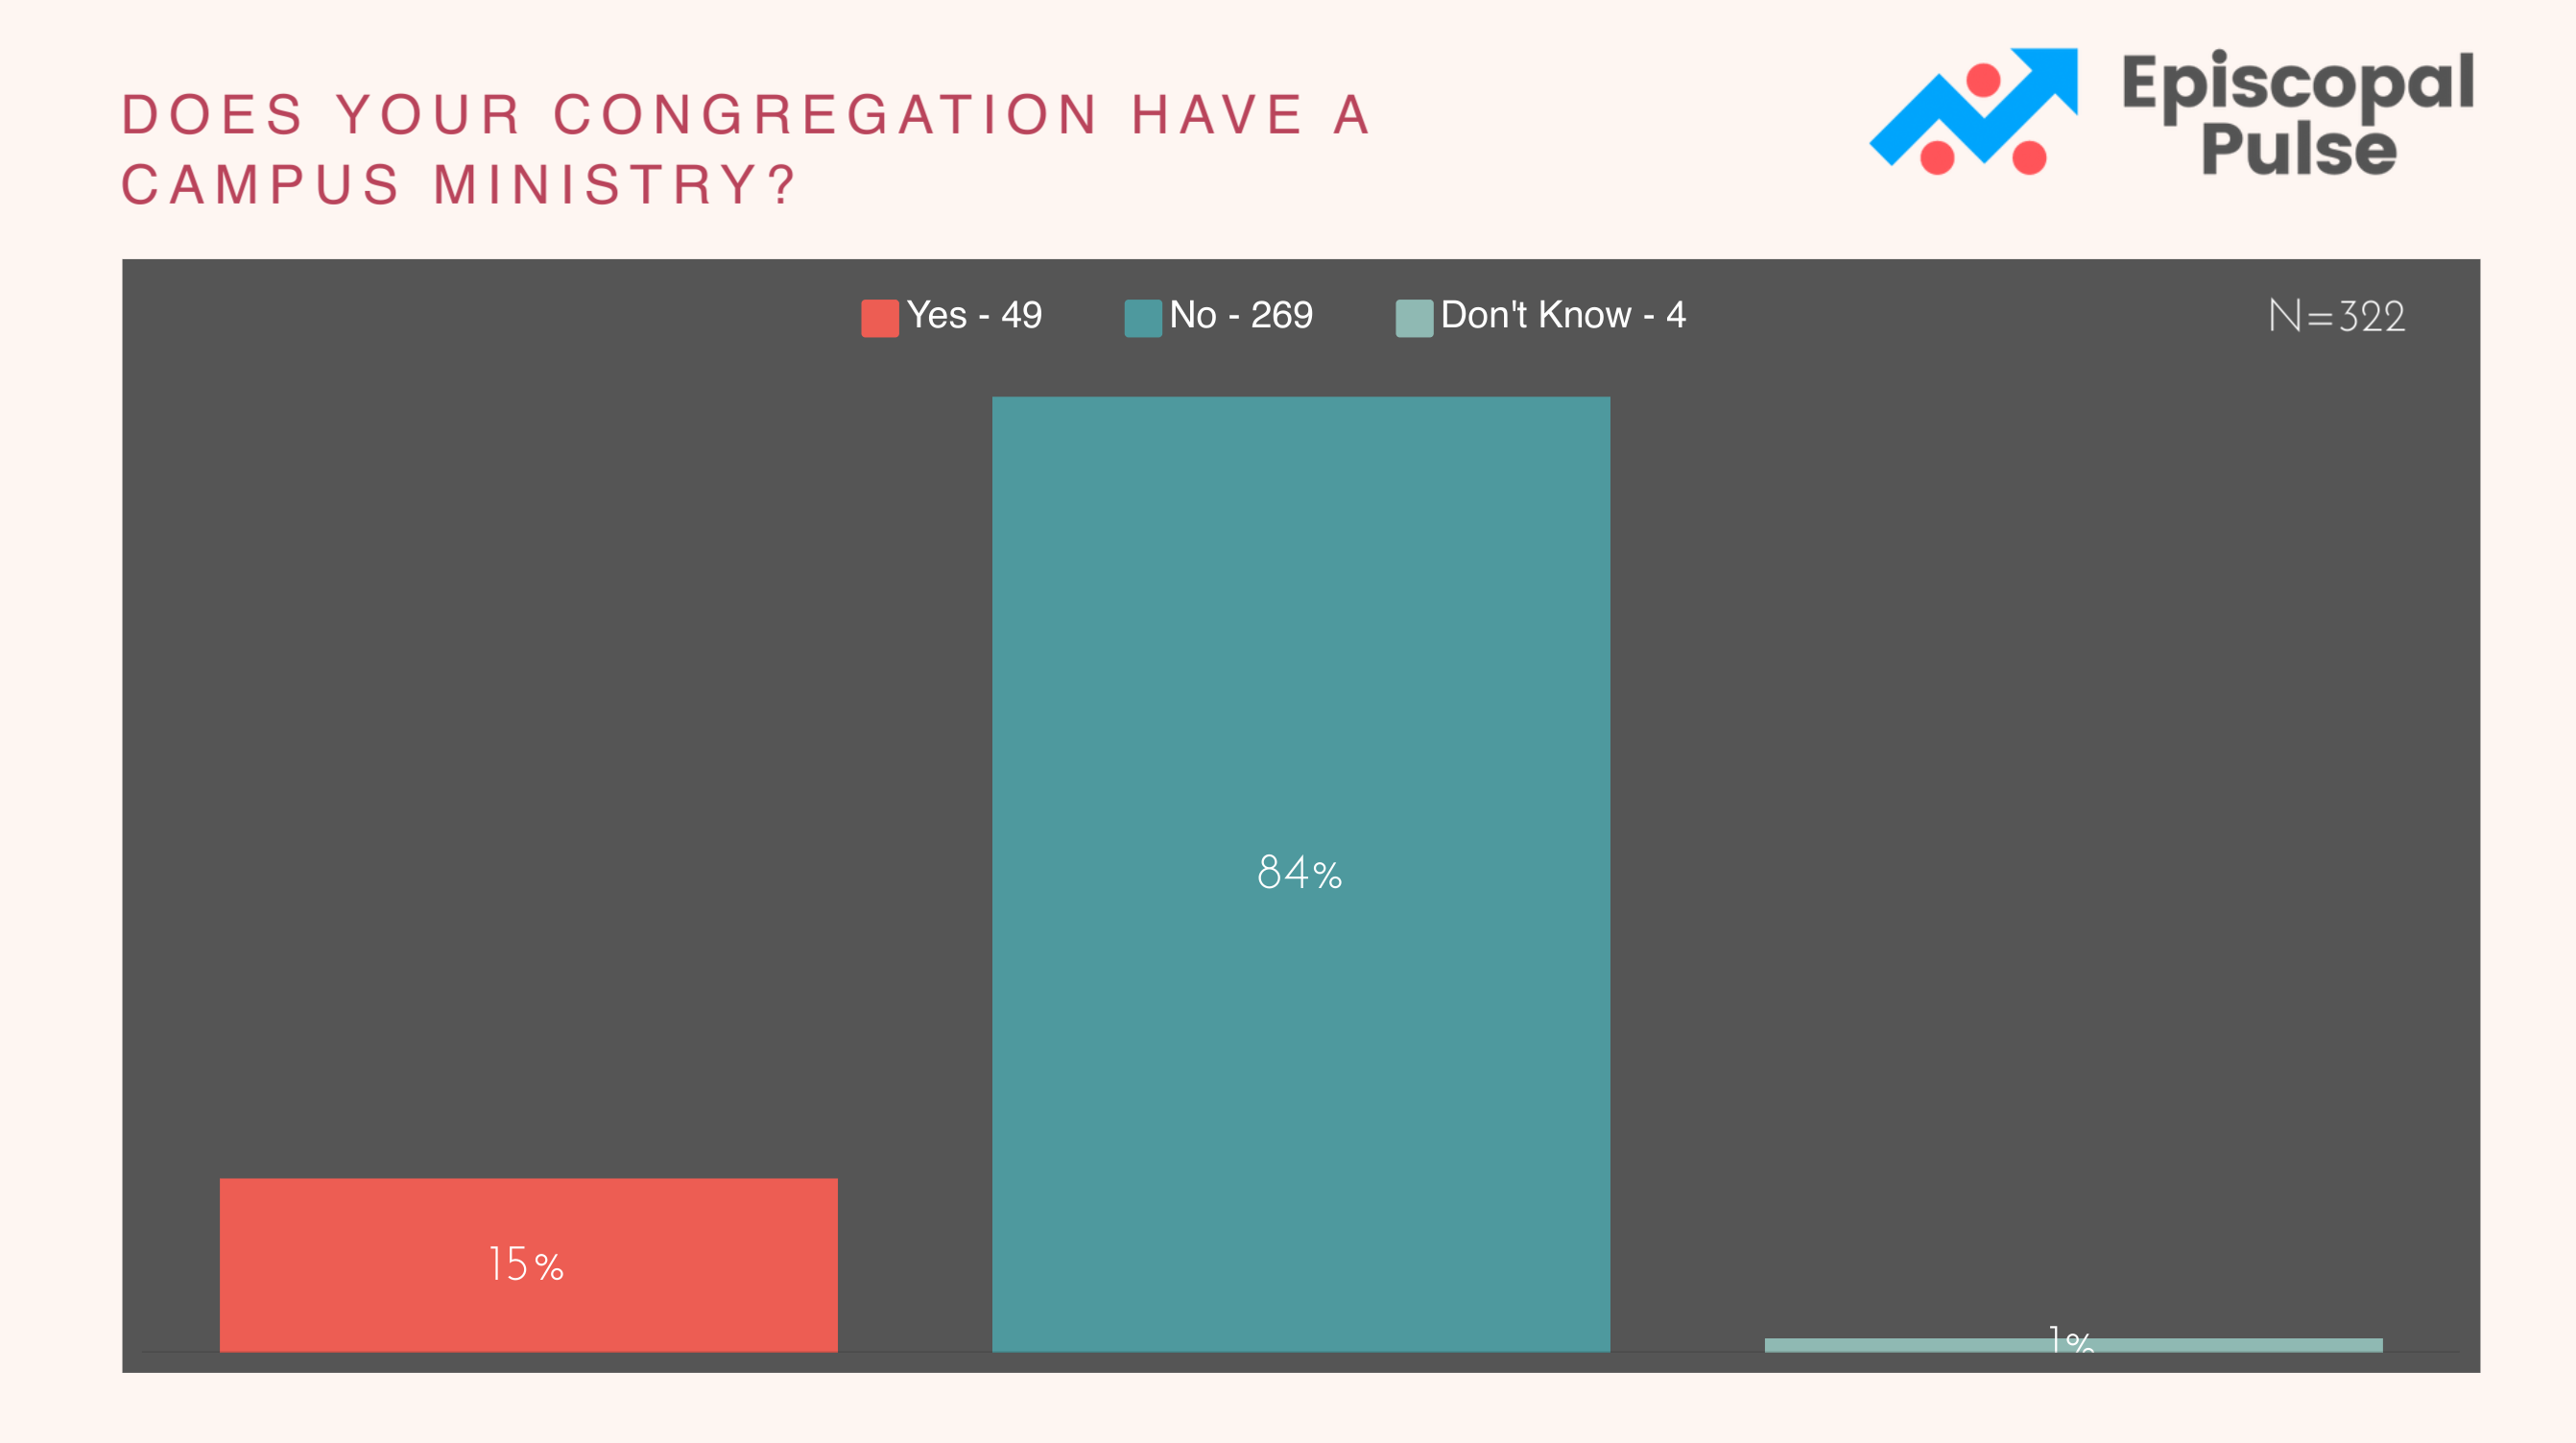
Results (N=322):
- Yes - 49 (15%)
- No - 269 (84%)
- Don't Know - 4 (1%)
Survey 34: Ideal
In your opinion…
(a) What would be the ideal relationship between congregations and their dioceses? (b) What is the actual relationship between your congregation and your diocese?
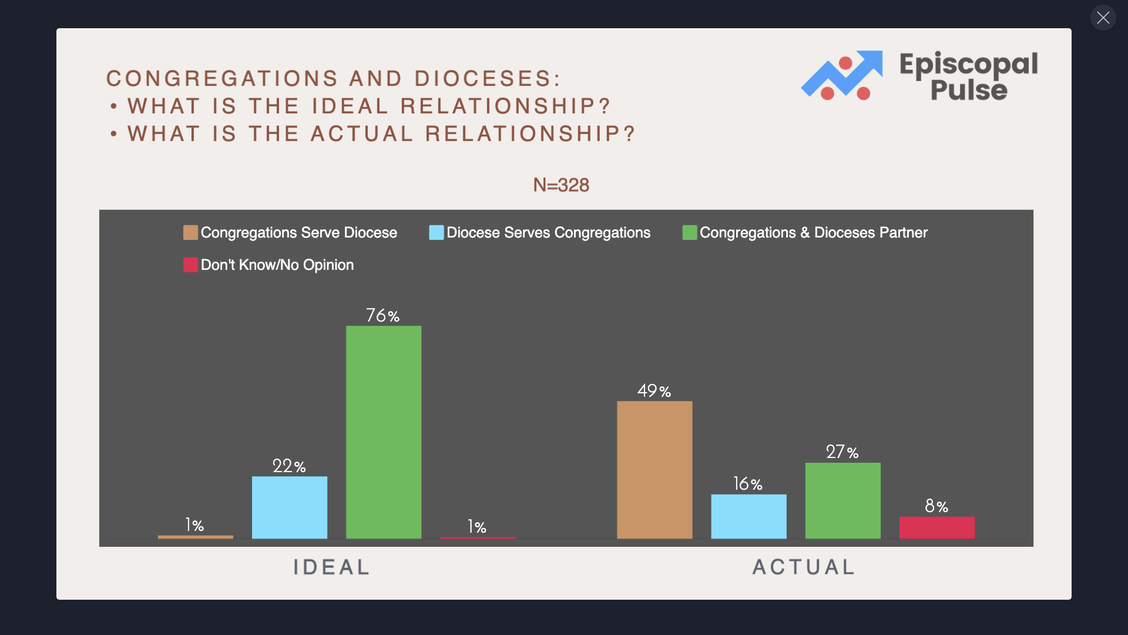
Results (N=328):
- Congregations Serve Diocese – Ideal: 1% (4) | Actual: 49% (161)
- Dioceses Serves Congregations – Ideal: 22% (73) | Actual: 16% (52)
- Congregations & Diocese Partner – Ideal: 76% (259) | Actual: 27% (89)
- Don’t Know/No Opinion – Ideal: 1% (2) | Actual: 6% (26)
Key Insights:
- 3/4 of respondents said the IDEAL relationship is PARTNERSHIP, while only 1/4 said it is the ACTUAL relationship.
- Only 1% of respondents say the IDEAL relationship CONGREGATIONS SERVING THE DIOCESE, while nearly 1/2 say that is the ACTUAL relationship.
Survey 33: Changes
In what areas of congregational life has the pandemic made lasting changes in how your church pursues its ministries?
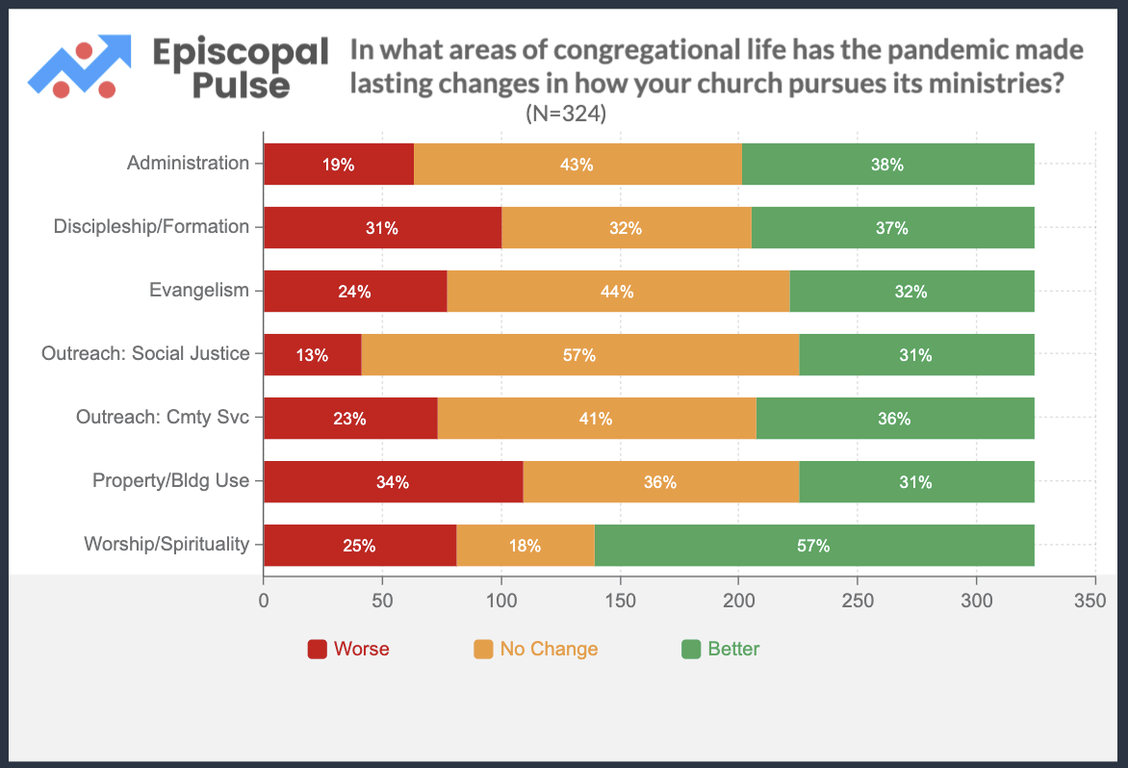
- Administration – Worse: 19% | N/C: 43% | Better: 38%
- Discipleship/Formation – Worse: 31% | N/C: 32% | Better: 37%
- Evangelism – Worse: 24% | N/C: 44% | Better: 32%
- Outreach: Social Justice – Worse: 13% | N/C: 57% | Better: 31%
- Outreach: Cmty Svc/Partnerships – Worse: 23% | N/C: 57% | Better: 36%
- Property/Building Use – Worse: 34% | N/C: 36% | Better: 32%
- Worship & Spirituality – Worse: 25% | N/C: 18% | Better: 57%
N=324 | N/C=No Change
Key Insights:
- Greatest Percentage Improved: Worship/Spirituality (57%)
- No Close 2nd
- Greatest Percentage Unchanged: Outreach/Social Justice (57%)
- Close 2nd: Evangelism (44%)
- Greatest Percentage Worsened: Property/Bldg Use (34%)
- Close 2nd: Discipleship (31%)
Survey 32: Giving
Why do you give to your congregation?
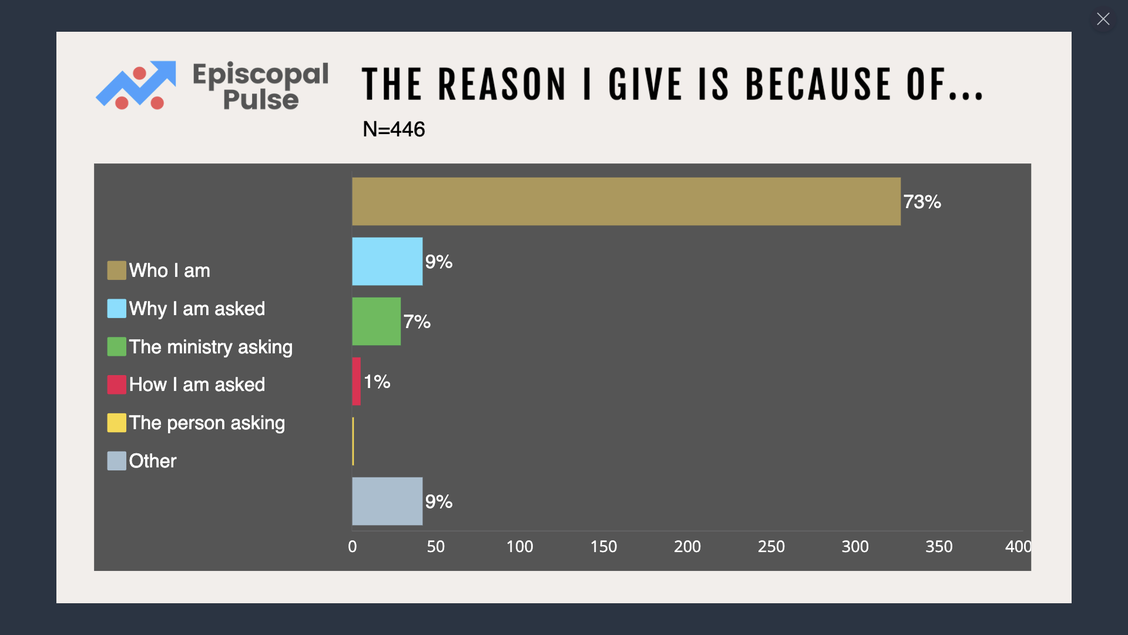
Why do you give to your congregation?
(N=468)
- I give because of who I am: 327 (73%)
- I give because of why I am asked: 42 (9%)
- I give because of the ministry asking: 29 (7%)
- I give because of how I am asked: 5 (1%)
- I give because of the person asking: 1 (less than 1%)
- Other: 42 (9%)*
Other included:
- Because of who God is (all that I have and am are a gift of God): 2
- Because it is part of my spiritual practice/theology/relationship with God and my neighbor: 2
- Because it is my responsibility as a priest/leader to set an example: 2
- Because I have more than I need: 1
- Because I believe in the mission of our church: 1
- Because my church welcomes small gifts as much as large: 1
Key Insights:
Barna Research recently published the results of a nearly identical survey with practicing Christians nationwide.
The answers they got were:
- I give because of who I am (69%)
- I give because of why I am asked (11%)
- I give because of how I am asked (8%)
- I give because of the person asking (7%)
- I give because of the ministry asking (6%)
Comparing these two similar surveys, we can draw the conclusions:
- “Because of who I am” (an internal factor) is the top choice for both Christians nationwide and Episcopalians nationwide. Also, most of the reasons listed under Other were internal motivating factors, if included, these would raise the total of internal motivating factors to 75%.
- Episcopalians are 4% more like to give that reason that the general Christian population.
- Both Episcopalians and Christians nationwide are significantly less likely to give for all the other reasons (all external factors) combined (by a factor of more than two-to-one).
Survey 31: Endowment
To the best of your knowledge:
- Does your congregation have an endowment?
- If so, what does your congregation primarily use the investment proceeds for?
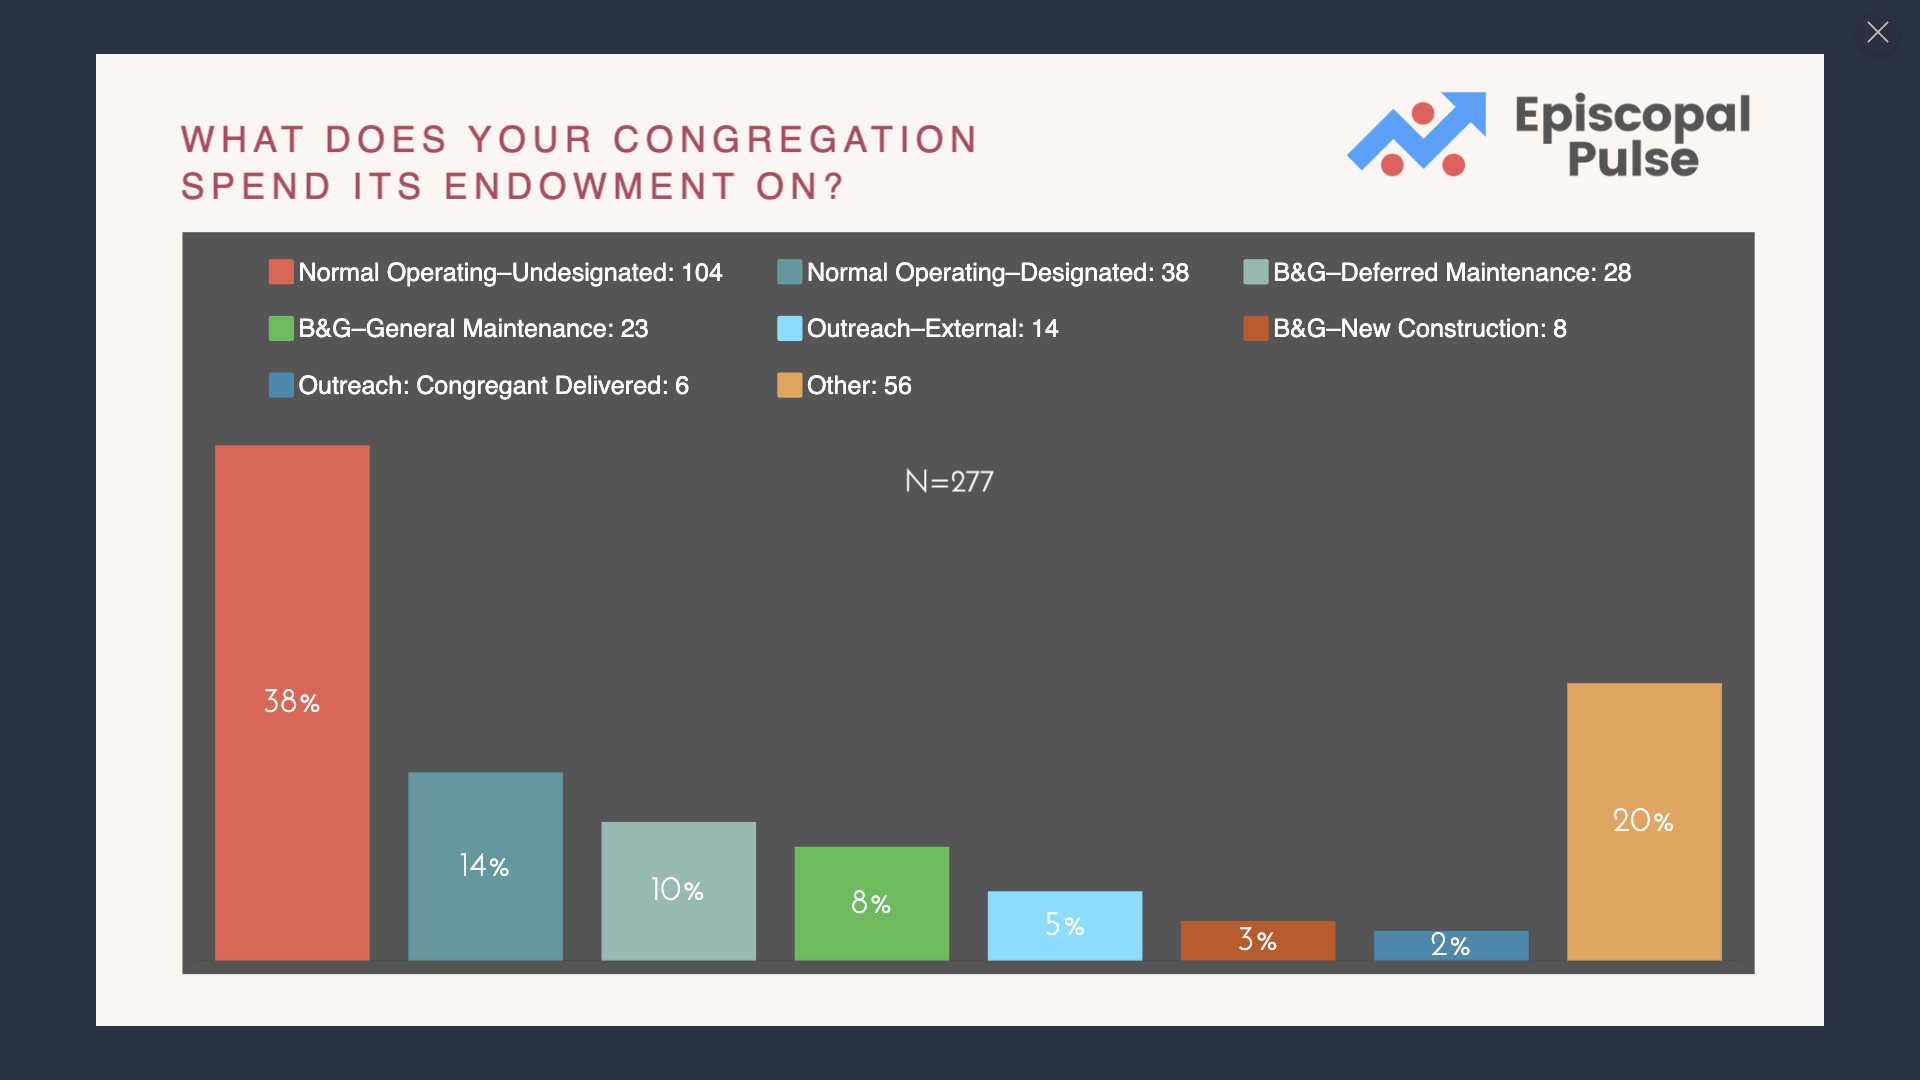
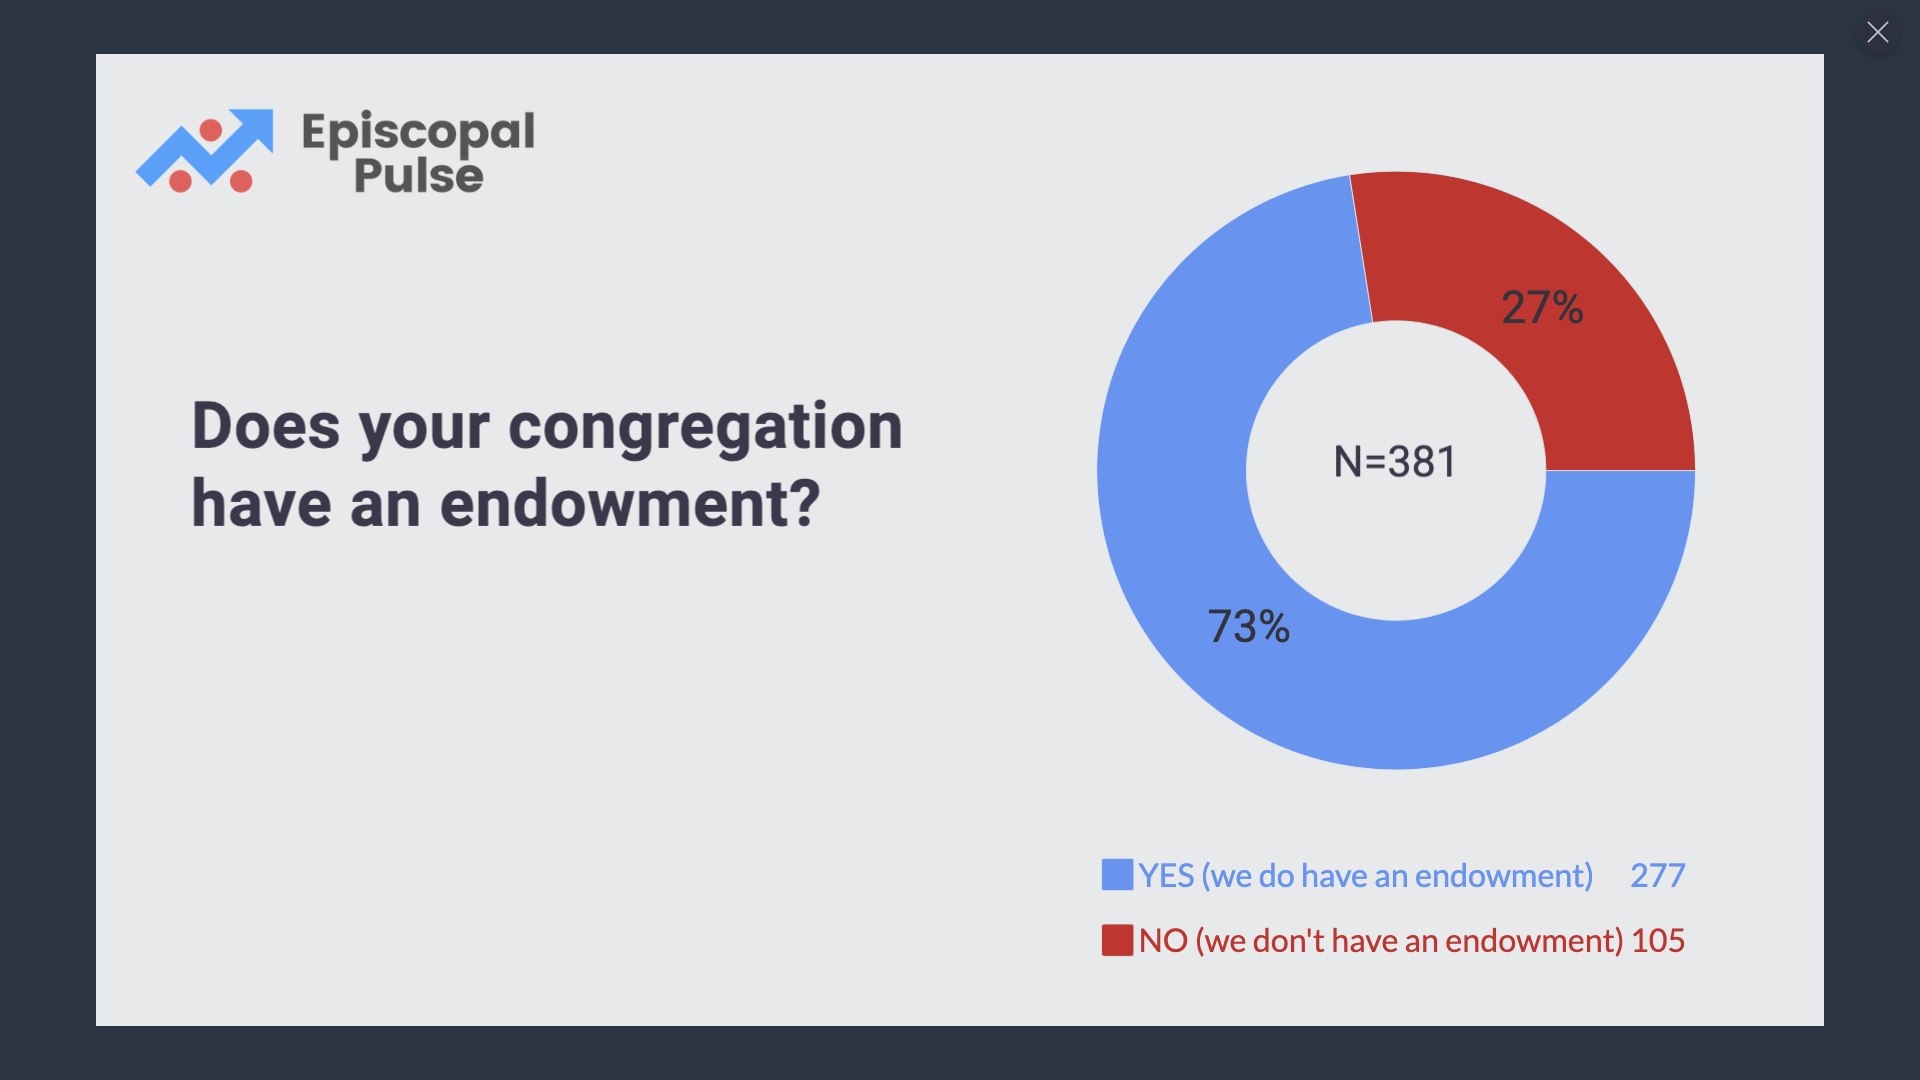
Does your congregation have an endowment? (n-381)
- YES (My congregation does have an endowment): 73% (277)
- NO (My congregation doesn’t have an endowment? 27% (105)
If so, what does your congregation primarily use the investment proceeds for?
N-277
- Normal Operating–Undesignated: 38% (104)
- Normal Operating–Designated (staff, programs, etc.): 14% (38)
- Buildings & Grounds–Deferred Maintenance: 10% (28)
- Buildings & Grounds–General Maintenance: 8% (23)
- Outreach–External Charitable Organizations: 5% (14)
- Buildings & Grounds–New Construction: 3% (8)
- Outreach–Congregant Delivered: 2% (5)
- Other: 20% (56)
Key Insights:
Nearly three quarters (73%) of respondents’ answered that their congregations have endowments vs. more than one quarter (27%) that did not.
Of those 277 with endowments:
87% used their endowments primarily for categories other than New Construction (3%) or Deferred Maintenance (10%), with the remaining 9/10ths regularly using for categories that would best be spent from general operating funds.
Even if we exclude Other as a category, the remainder still would be the overwhelming majority by a two-to-one margin.
For Reflection
Assuming these numbers accurately represent the state of The Episcopal Church…
It is concerning that the vast majority are using their endowments for spending categories that should most appropriately come from general operating funds.
Could this be a sign that most Episcopal congregations are managing decline, with little hope of achieving sustainability?
Which of these results surprise you, which confirm what you you thought you knew, and what do you make of these results?
Survey 30: Reconcile
To the best of your knowledge (check all that apply):
- Does your congregation or diocese offer any programs in racial reconciliation?
- Have you participated in any racial reconciliation programs offered by your congregation or diocese?
Racial Reconciliation Programs Offered/Taken
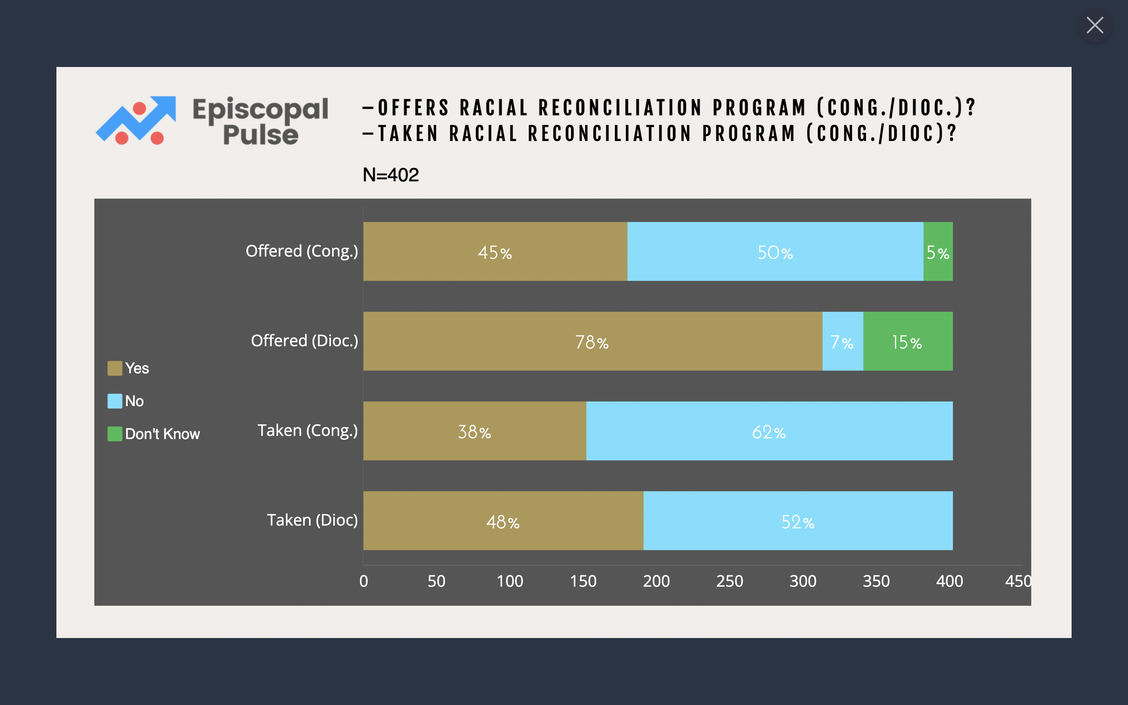
N=402
- Congregation Offers – Yes: 45% | No: 50% | Don’t Know: 5%
- Diocese Offers – Yes: 78% | No: 7% | Don’t Know: 15%
- Participated in Congregational Program – Yes: 38% | No: 62%
- Participated in Diocesan Program – Yes: 48% | No: 52%
Key Insights:
- A majority of respondents’ dioceses offer racial reconciliation programs (78%).
- Half of respondents’ congregations (50%) do not offer any racial reconciliation programs.
- A majority of respondents (52-62%) have not participated in any racial reconciliation programs.
Survey 29: Demographics
Which neighborhood demographic tools are you aware of? Have you used?
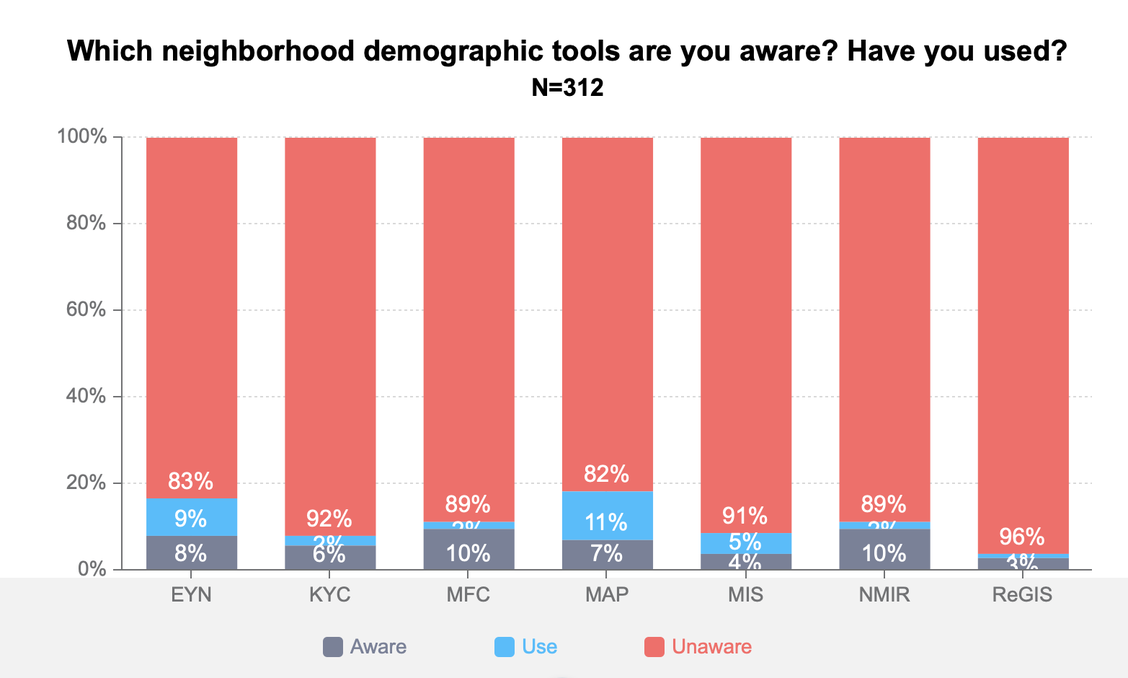
Neighborhood Demographic Tools Awareness & Use (percentages):
N=312
- EYN (Explore Your Neighborhood) – Aware: 8% | Used: 9% | Unaware: 83%
- KYC (Know Your Community) – Aware: 6% | Used: 2% | Unaware: 92%
- MFC (MapDash for Faith Communities) – Aware: 10% | Used: 2% | Unaware: 89%
- MAP (Ministry Area Profile) – Aware: 7% | Used: 11% | Unaware: 82%
- MIS (MissionInSite) – Aware: 4% | Used: 5% | Unaware: 91%
- NMIR (Neighborhood Missional Intelligence Report) – Aware: 10% | Used: 2% | Unaware: 82%
- ReGIS – Aware: 3% | Used: 1% | Unaware: 96%
Key Insights:
- The vast majority of respondents (81%–96%) of are unaware of the neighborhood demographic tools available to them.
- Ministry Area Profite is the most used vitality assessment tool (but only at 11%). All others are under 10%.
- A miniscule percentage (1%-10%) of respondents were aware of but had not used neighborhood demographics
Survey 28: Diagnostics
Which vitality diagnostic tools are you aware of? Have you used?
(check all applicable responses)
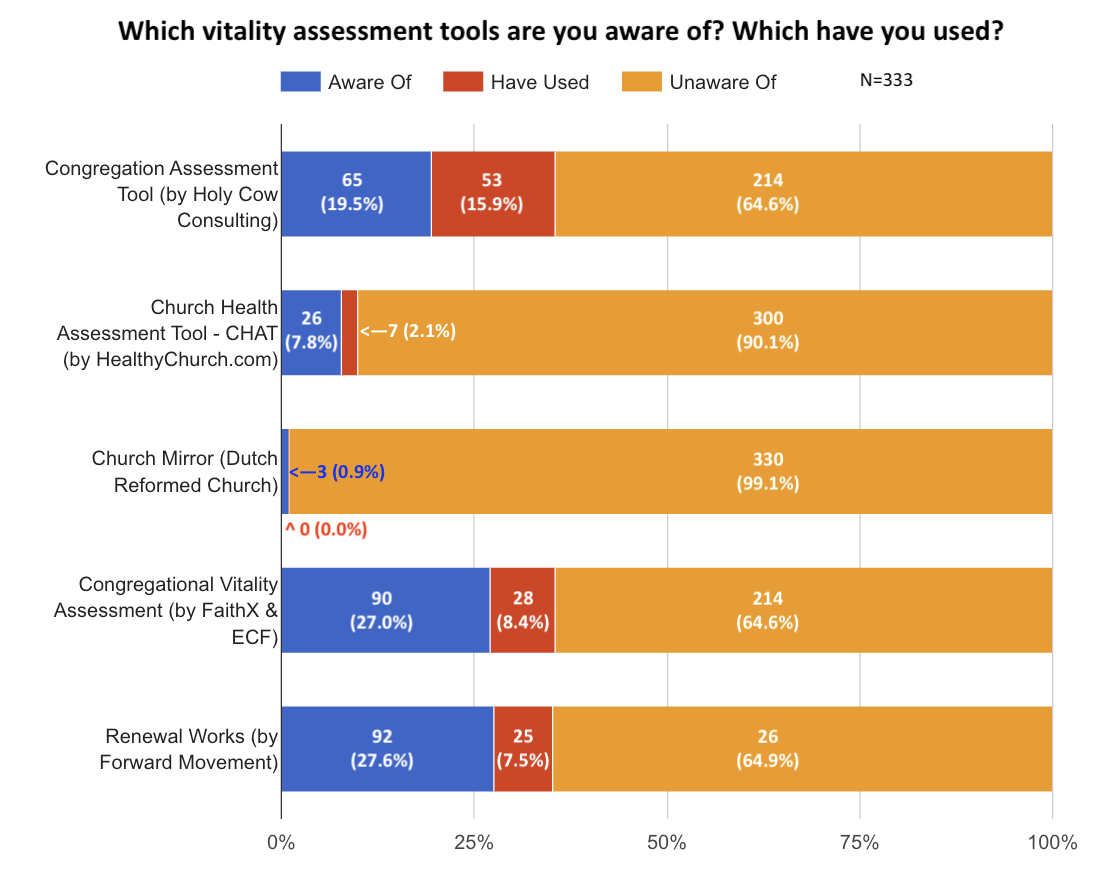
Vitality Assessment Tools Awareness & Use (percentages):
N=409
- Holy Cow: Aware=19.5 | Used=15.9 | Unaware=64.6
- Church Health Assessment Tool: Aware=7.8 | Used=2.1 | Unaware=90.1
- Church Mirror: Aware=0.9 | Used=0.0 | Unaware=99.1
- Congregational Vitality Assessment (CVA): Aware=27.0 | Used=8.4 | Unaware=64.6
- Renewal Works: Aware=27.6 | Used=7.5 | Unaware=64.9
Key Insights:
- The vast majority of respondents (64%-99%) of are unaware of the various vitality assessment tools available to them.
- Holy Cow is the most used vitality assessment tool (but only at 15.9%), while the CVA is 2nd most used (8.4%) and Renewal Works is a close 3rd (7.5%).
- Renewal Works and the CVA are in a virtual tie for the vitality tool respondents were most aware of (at 27.6% and 27.0%, respectively).
Survey 27: A Difference
Our congregation makes such a difference in the neighborhoods around it that if it closed tomorrow, the community would immediately notice.
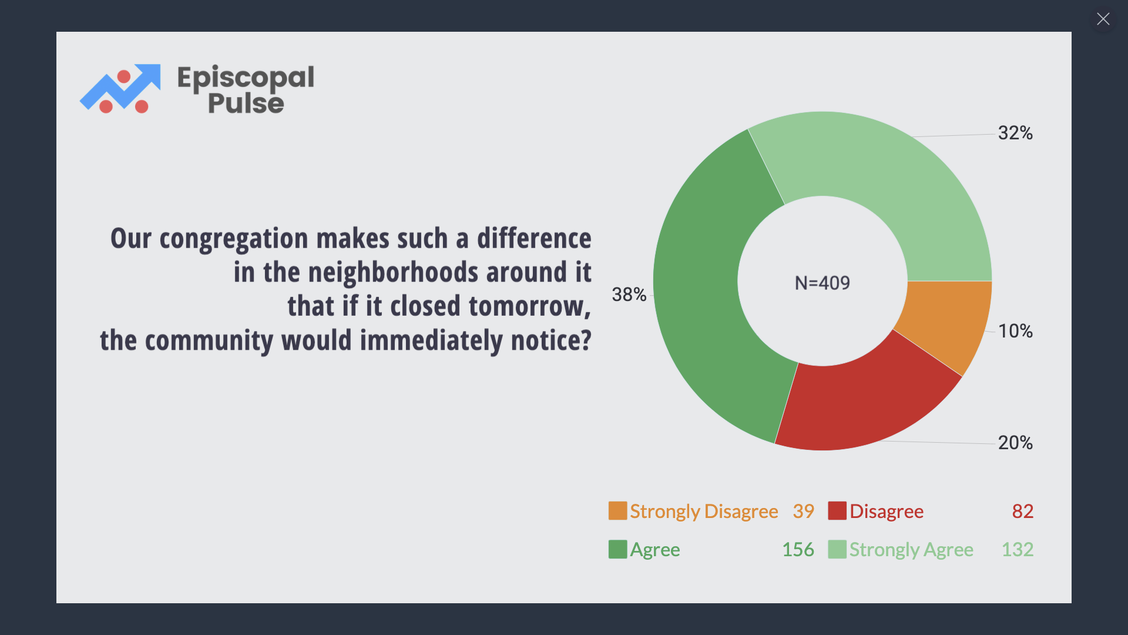
By the numbers (N=409):
- Strongly Disagree: 39 (9.5%)
- Disagree: 82 (20%)
- Agree: 156 (38.1%)
- Strongly Agree: 132 (32.3%)
Key Insights:
- Roughly two-thirds of respondents answered Agree (38.1%) or Strongly Agree (32.3%).
- Roughly one-third of respondents answered Disagree (20%) or Strongly Disagree (9.5%).
For Reflection
Assuming these numbers accurately represent the state of The Episcopal Church…
It is not a good sign that a third of Episcopal congregations could close without anyone in the neighborhood around it noticing.
It is also concerning that only a third of the congregations could state with certainty that the neighborhood would notice if they closed.
If you were triaging the congregations of The Episcopal Church, how would you sort them out in terms of the likelihood that missional interventions could help them survive and thrive?
Which of these results surprise you, which confirm what you you thought you knew, and what do you make of these results?
Survey 26: Reach Out
How far outside your congregation’s walls does your outreach reach?
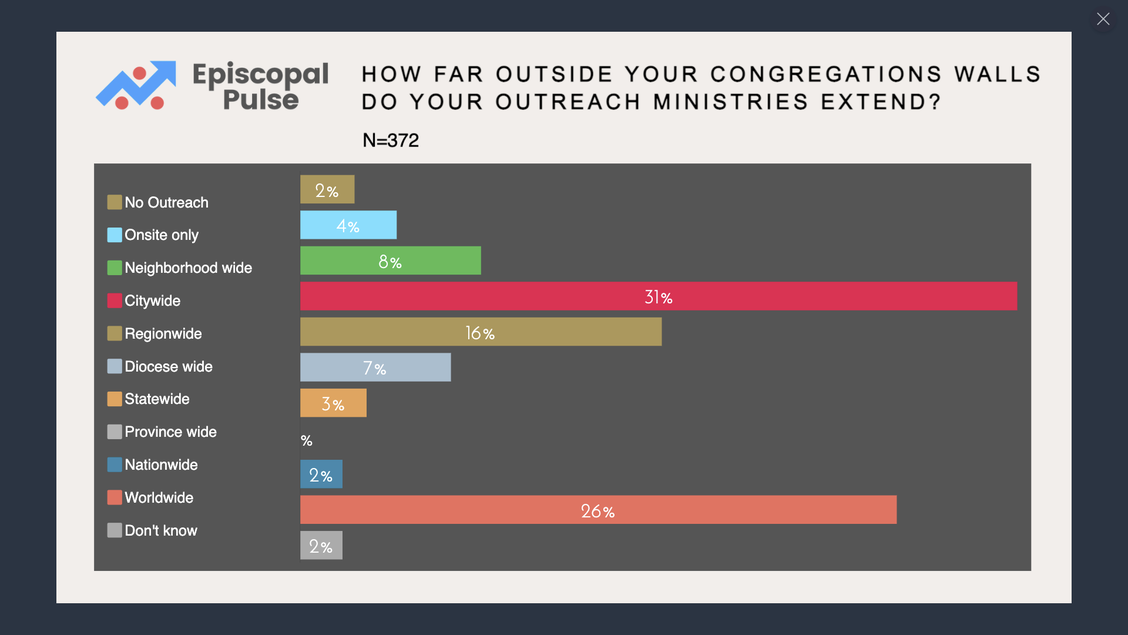
Outreach Reach by the numbers (N=383):
- No Outreach: 9 (2.3%)
- Onsite only: 16 (4.2%)
- Neighborhood wide: 30 (7.8%)
- Citywide: 119 (31.1%)
- Regionwide: 60 (15.7%)
- Diocese wide: 25 (6.5%)
- Statewide: 11 (2.9%)
- Province wide: 0 (0.0%)
- Nationwide: 7 (1.8%)
- Worldwide: 99 (25.8%)
- Don't know: 7 (1.8%)
Key Insights:
- The predominant answers, comprising a sold majority of respondents (56.9%), were Citywide (31.1%) and Worldwide (25.8%).
- NO congregations were involved in province-wide outreach efforts.
- Only 2.33% reported No Outreach & 4.2% reported Onsite Outreach Only.
For Reflection
Why is there is so little outreach reported between Citywide and Worldwide efforts?
And why do ZERO respondents report their congregations involve in Province-wide Outreach efforts?
- Is this because these venues were deemed not cost effective?
- Is this because the other categories were untapped opportunities?
- Or is there some other explanation?
Which of these results surprise you, which confirm what you you thought you knew, and what do you make of these results?
Survey 25: Status
What is the status of your online worship service(s) in these almost but not really post-Covid times?
- We never offered any online worship services.
- We discontinued our online worship services.
- We continue offering live streamed video of our in-person services.
- We are design our online worship services to suit the specific needs of an online congregation.
- Other
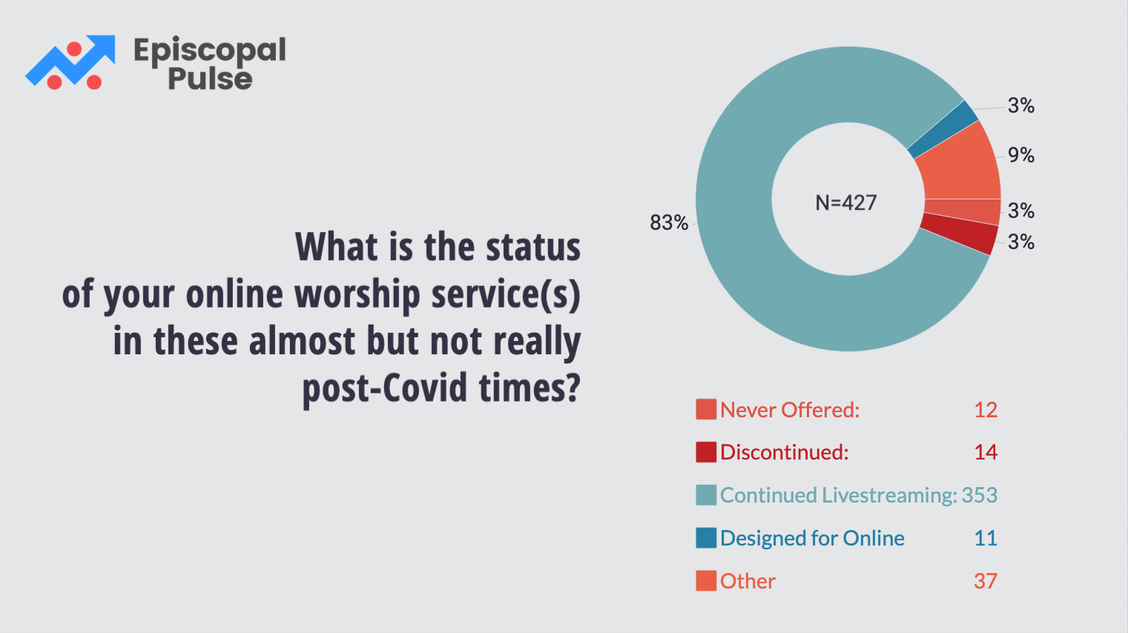
By the numbers (N=404):
- We never offered any online worship services: 12 (3%)
- We discontinued our online worship services: 14 (3%)
- We continue offering live streamed video of our in-person services: 353 (83%)
- We are designing our online worship services to suit the specific needs of an online congregation: 11 (3%)
- Other: 37 (9%)
Key Insights:
- The vast majority of respondents (over 80%) report that their congregations are continuing to live stream their In Person Worship Services.
- About 6% report that their congregations either have discontinued their online services or never started them in the first place.
- Only 3% report that they are designing their online services for the specific needs of an online congregation.
For Reflection
What is the meaning behind these numbers?
Recent surveys have shown that online services are especially attractive to Millenials as a complement to in person worship but only if they are designed for an online community rather than simply allowing them to observe others worshipping.*
While it’s a good thing that the vast majority of congregations have not turned their backs on their online congregations by continuing their live streaming, it’s worth considering how big of an opportunity they may be missing by not treating their online community as a discrete worshipping group with their own unique needs.
Which of these results surprise you, which confirm what you you thought you knew, and what do you make of these results?
*Digital Religion Among U.S. and Canadian Millennial Adults, was published in the Review of Religious Research.
Survey 24: Rush
To what extent are families/households with young children (i.e., preschool-age) returning to church attendance and/or engagement compared to their involvement before COVID?
- Rushing back (increased participation)
- Slowly returning (same participation)
- Not around at all (steep decline in participation)
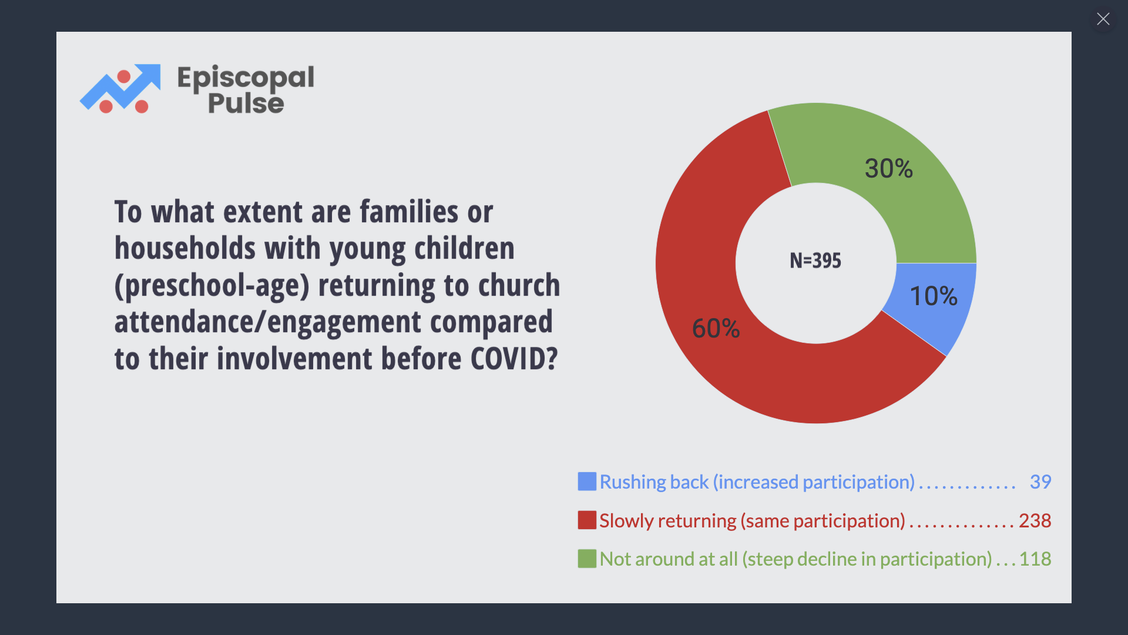
By the numbers (N=395):
- Rushing back (increased participation): 39 (10%)
- Slowly returning (same participation): 238 (60%)
- Not around at all (steep decline in participation): 118 (30%)
Key Insights:
Families with young children are not exactly beating down the “big red door” to come back to church.
- The vast majority of respondents (60%) report that such families are petering in at a rate that will eventually return to pre-Covid levels.
- A sizeable minority of respondents (30%) report that such families are not returning at all.
- Only a small minority of respondents report that such families are rushing back back to church.
For Reflection
What do you think are behind these numbers?
Do you think that the rate of return of families with small children will actually rise to pre-Covid levels? Or is that too optimistic?
About a third of respondents report a sharp drop in participation by families with young children. Do you think that percentage will stay the same? Or do you think it will grow (or shrink)?
Only a tenth of respondents report that families with young children really are beating down the door to re-engage with the congregation. Why do you think that percentage is so low? What do you suppose is different in churches to which families with young children are flooding back in?
Which of these results surprise you, which confirm what you you thought you knew, and what do you make of these results?
Survey 23: Sharing
In the last year, have shared something about your faith with someone outside of church or your immediate family?
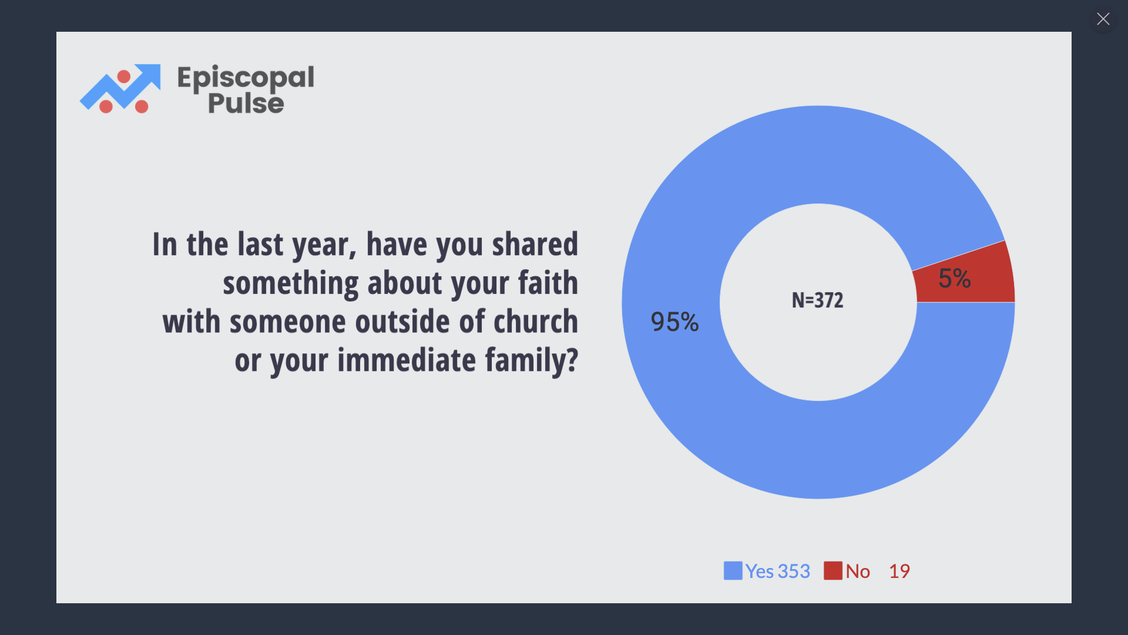
By the numbers (N=372):
- YES: 353 (95%)
- NO: 19 (5%)
In the last year, what percentage of your congregation has shared something about their faith with someone outside of church or their immediate family? [best estimate]
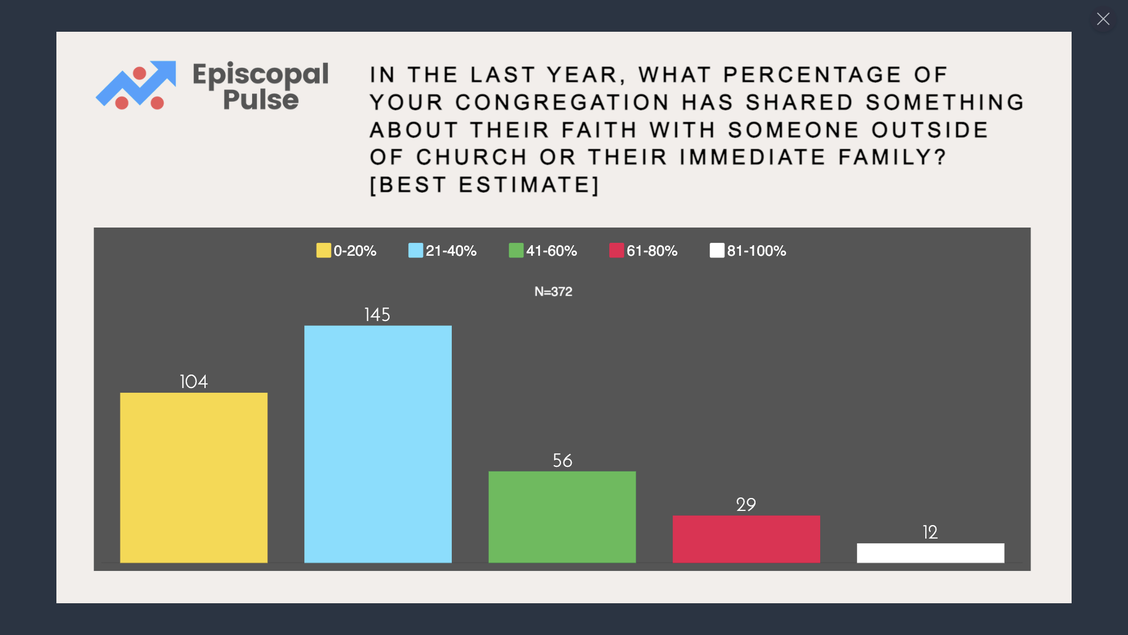
By the numbers (N=495):
- 0-20%: 104 (28%)
- 21-40%: 145 (39%)
- 41-60%: 56 (15%)
- 61-80%: 29 (8%)
- 81-100%: 12 (3%)
Key Insights:
The vast majority of respondents (95%) have shared something of their faith outside of church or immediate family.
In the vast majority of congregations (39%) there is little or no sharing of faith outside of church or immediate family.
For Reflection
The results of this week’s microsurvey about sharing of faith tracks closely with last week’s microsurvey on participation in discipleship groups, with an even more pronounced difference between respondents' answers about themselves than about their congregations…
What is the source of the huge difference between respondents’ answers for themselves vs. their answers for their congregation? Could it be that people who care more about sharing their faith are simply more willing to volunteer to answer questions about things like this than those who don’t?
Why do so many Episcopal churches have so much difficulty preparing congregants to share their faith? Could it be that they associate it with a conversion-oriented approach to evangelism? (as opposed to relational evangelism)
What does the fact that Episcopal congregations have so much trouble preparing congregants to share their faith say about their future ? Should we be expecting further decline in the years ahead?
Which of these results surprise you, which confirm what you you thought you knew, and what do you make of these results?
Survey 22: Small
In the last year, what percentage of your congregation has participated in a small group in order to support each other in integrating their faith in their daily life and work?
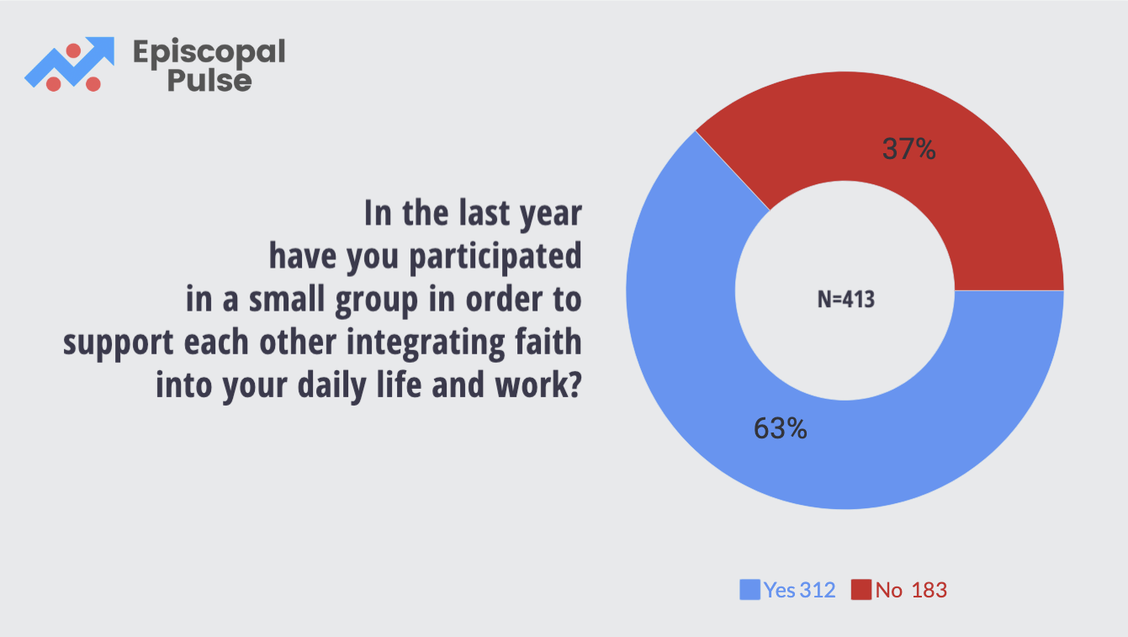
By the numbers (N=495):
- Yes: 312 (63%)
- No: 183 (37)
In the last year, what percentage of your congregation has participated in a small group in order to support each other in integrating their faith in their daily life and work?
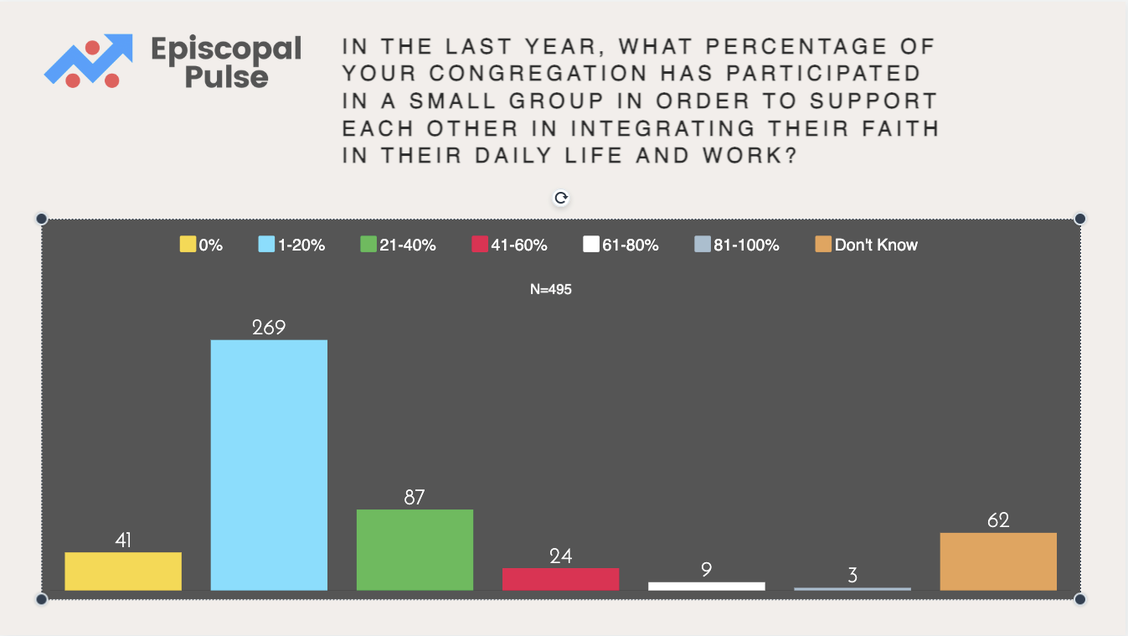
By the numbers (N=495):
- 0%: 41 (8%)
- 1-20%: 269 (54%)
- 21-40%: 87 (18%)
- 41-60%: 24 (5%)
- 61-80%: 9 (2%)
- 81-100%: 3 (1%)
- Don't Know: 62 (13%)
Key Insights:
- The vast majority of respondents (63%) have taken part in discipleship groups.
- In the vast majority of congregations (62%) there is little (54%) or no (8%) involvement in discipleship groups.
For Reflection
- What is the source of the big difference between respondents’ answers for themselves vs. their answers for their congregation? Could it be that people who care more about issues of discipleship are simply more willing to volunteer to answer questions about the the church than those who don’t?
- Why do so many Episcopal churches have so much difficulty preparing congregants to fulfill Jesus’ commandment to “make desciples of all nations?” Could it be that they associate it with a conversion-oriented approach to evangelism? (as opposed to relational evangelism)
- What does the fact that Episcopal congregations have so much trouble evangelism and discipleship say about their future ? Should we be expecting further decline in the years ahead?
- Which of these results surprise you, which confirm what you you thought you knew, and what do you make of these results?
Survey 21: Property
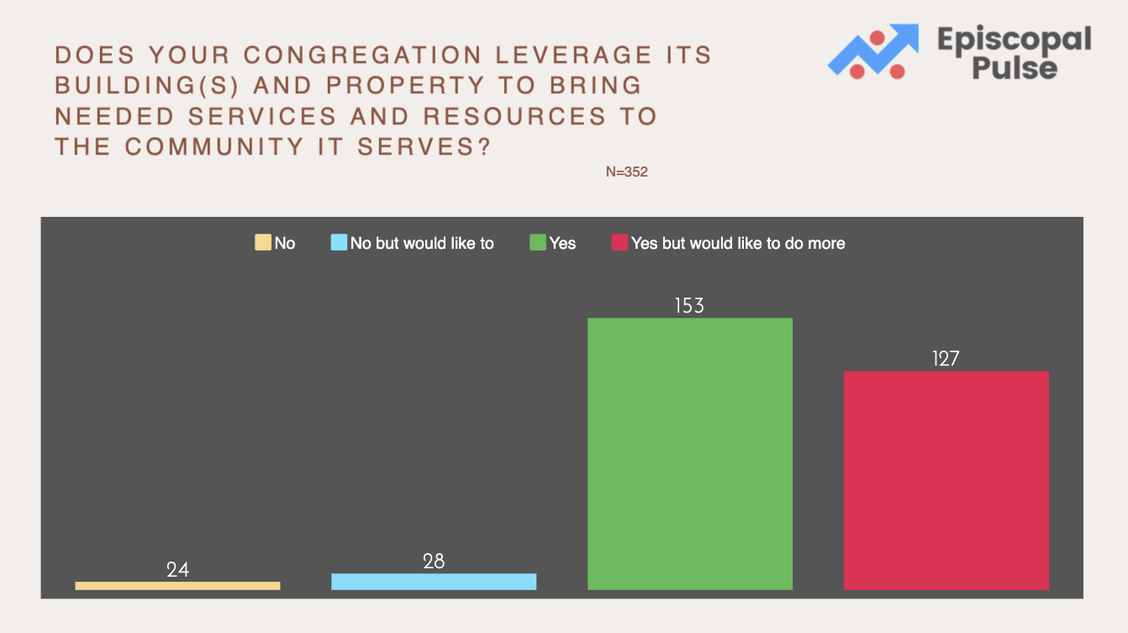
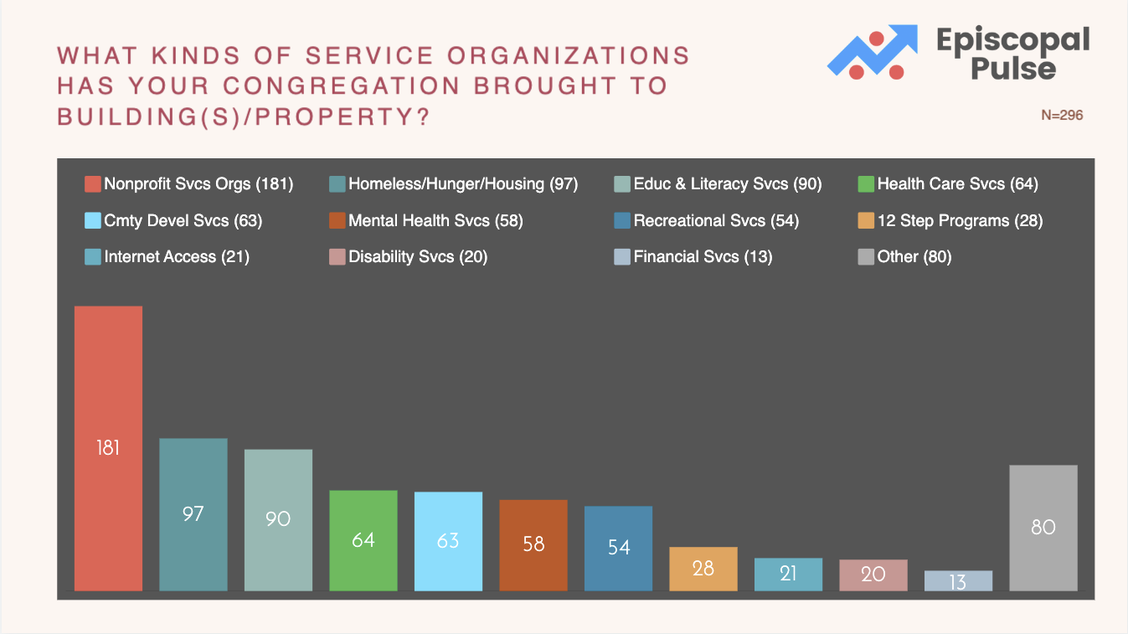
Does your congregation leverage its building and property to bring resources to the community it serves?
By the numbers (N=352):
- Yes (153)
- Yes but would like to do more (127)
- No but would like to (28)
- No (24)
If so, what What kinds of service organizations have your congregation brought to its building(s) & property?
By the numbers (N=296):
- Nonprofit Svcs Orgs (181)
- Homeless/Housing/Hunger (97)
- Educ & Literacy Svcs (90)
- 12-Step Programs (80)
- Health Care Svcs (64)
- Cmty Devel Svcs (63)
- Mental Health Svcs (58)
- Recreation Svcs (54)
- Disability Svcs (20)
- Internet Access (21)
- Financial Svcs (13)
- Employment Svcs (9)
- Other (80)
Survey 20: Services
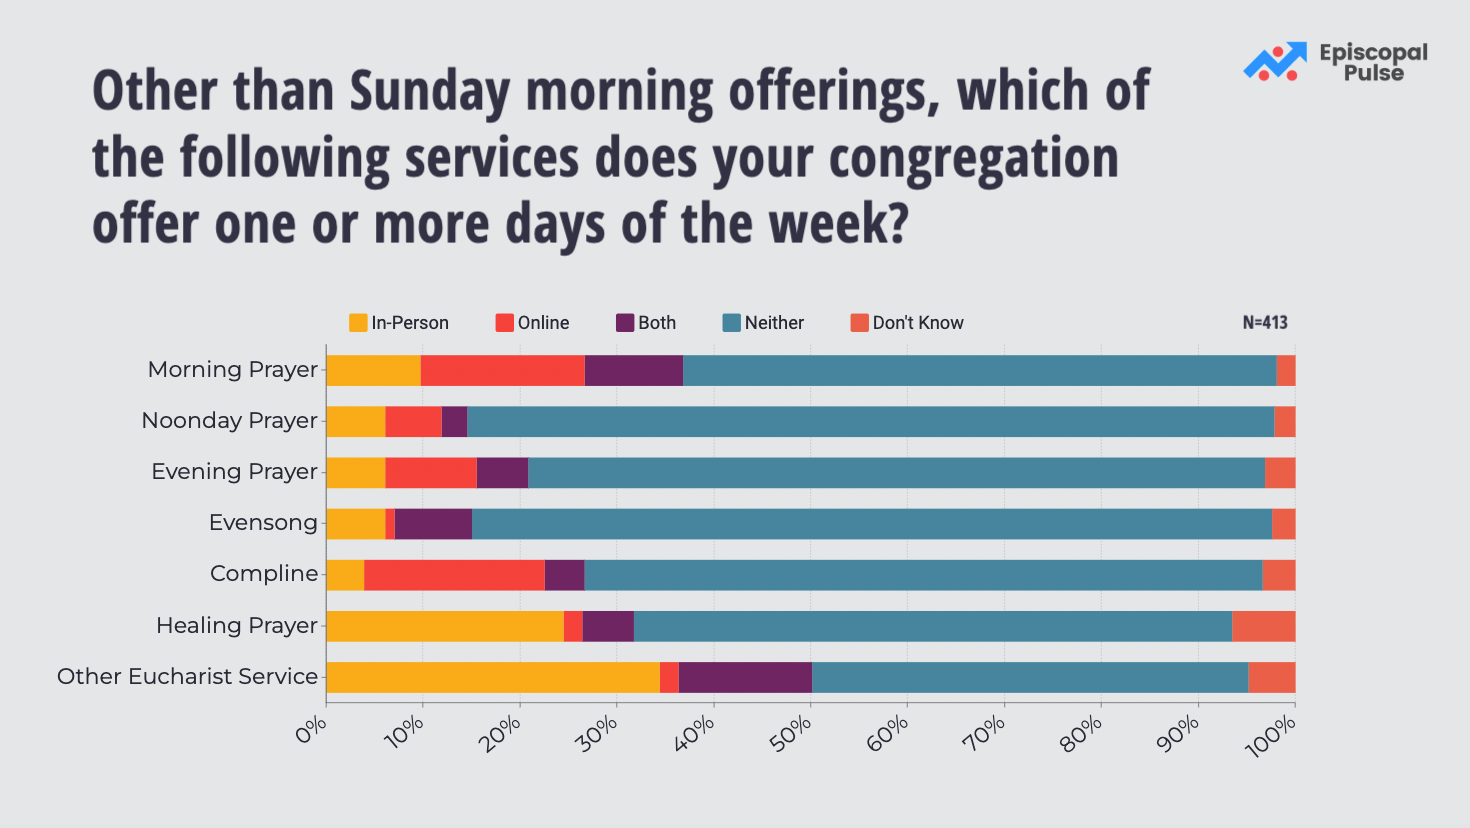
Click on the image to open in your browser and zoom in for more detail. Content continues after the image.
Question: Other than Sunday morning offerings, which of the following services does your congregation offer one or more days of the week?
Responses:
Morning Prayer: In-Person: 40 | Online: 70 | Both: 42 | Neither: 253 | Don't Know: 8
Noonday Prayer: In-Person: 25 | Online: 24 | Both: 11 | Neither: 344 | Don't Know: 9
Evening Prayer: In-Person: 25 | Online: 39 | Both: 22 | Neither: 314 | Don't Know: 13
Evensong: In-Person: 25 | Online: 4 | Both: 33 | Neither: 341 | Don't Know: 10
Compline: In-Person: 16 | Online: 77 | Both: 17 | Neither: 289 | Don't Know: 14
Healing Prayer: In-Person: 101 | Online: 8 | Both: 22 | Neither: 255 | Don't Know: 27
Other Eucharistic Service: In-Person: 142 | Online: 8 | Both: 57 | Neither: 186 | Don't Know: 20
Survey 19: Open Communion
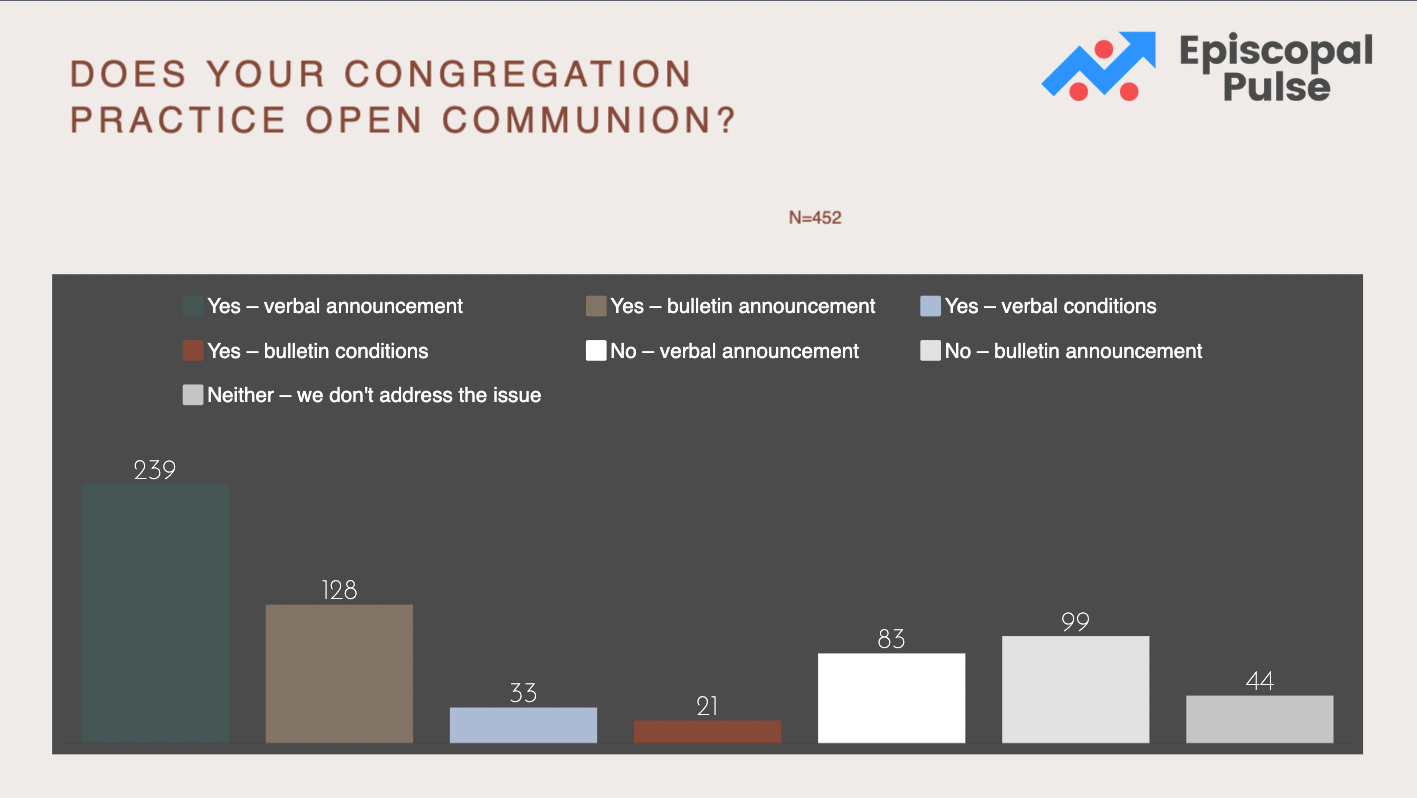
Question: Does your congregation practice open communion?
Responses:
Yes – with verbal announcement: 239
Yes – with bulletin announcement: 128
Yes – with verbal conditions: 33
Yes – with bulletin conditions: 21
No – with verbal announcement: 83
No – with bulletin announcement: 99
Neither – we don't address the issue: 44
Survey 18: Ethnicities
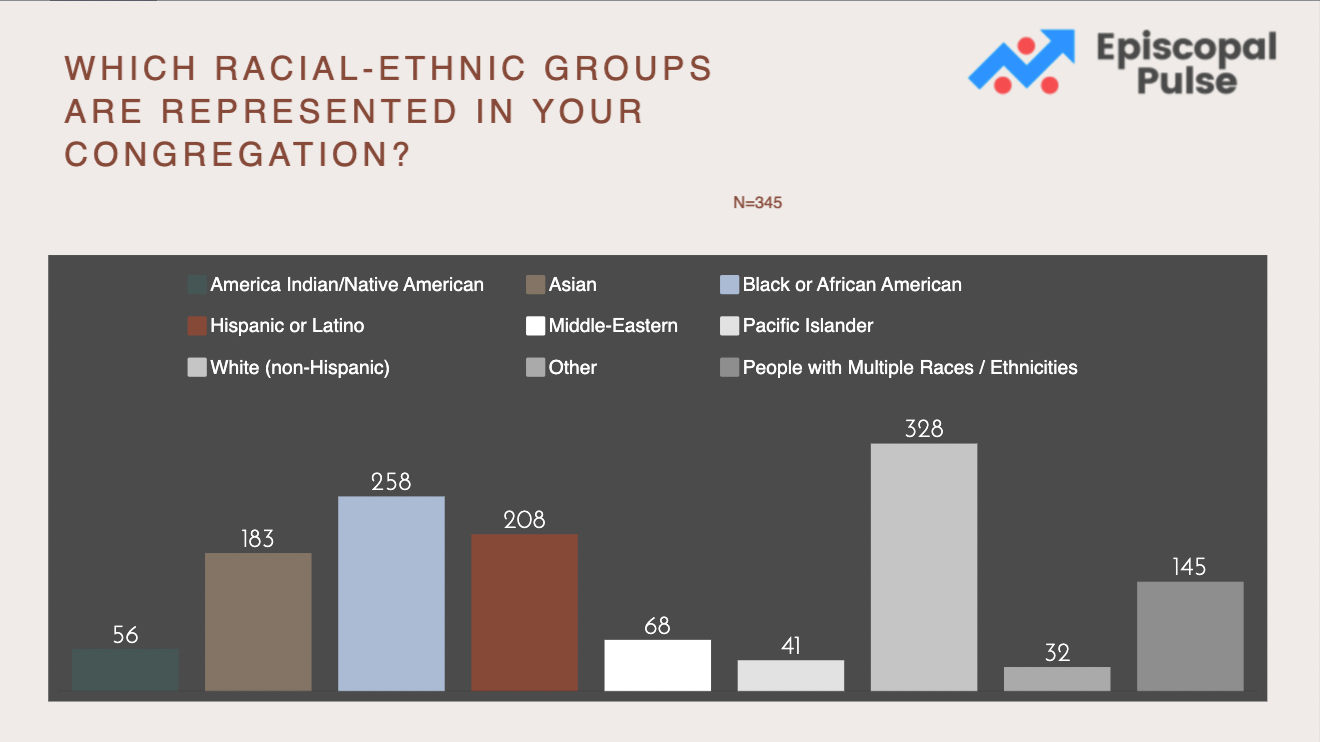
Question: Which racial-ethnic groups are represented in your congregation?
Responses: America Indian/Native American: 56 | Asian: 183 | Black or African American: 258 | Hispanic or Latino: 208 | Middle-Eastern: 68 | Pacific Islander: 41 | White (non-Hispanic): 328 | Other Race or Ethnicity: 32 | People with More Than One Race or Ethnicity: 145
Survey 17: Populations
Click the image below to open in your browser and zoom in..
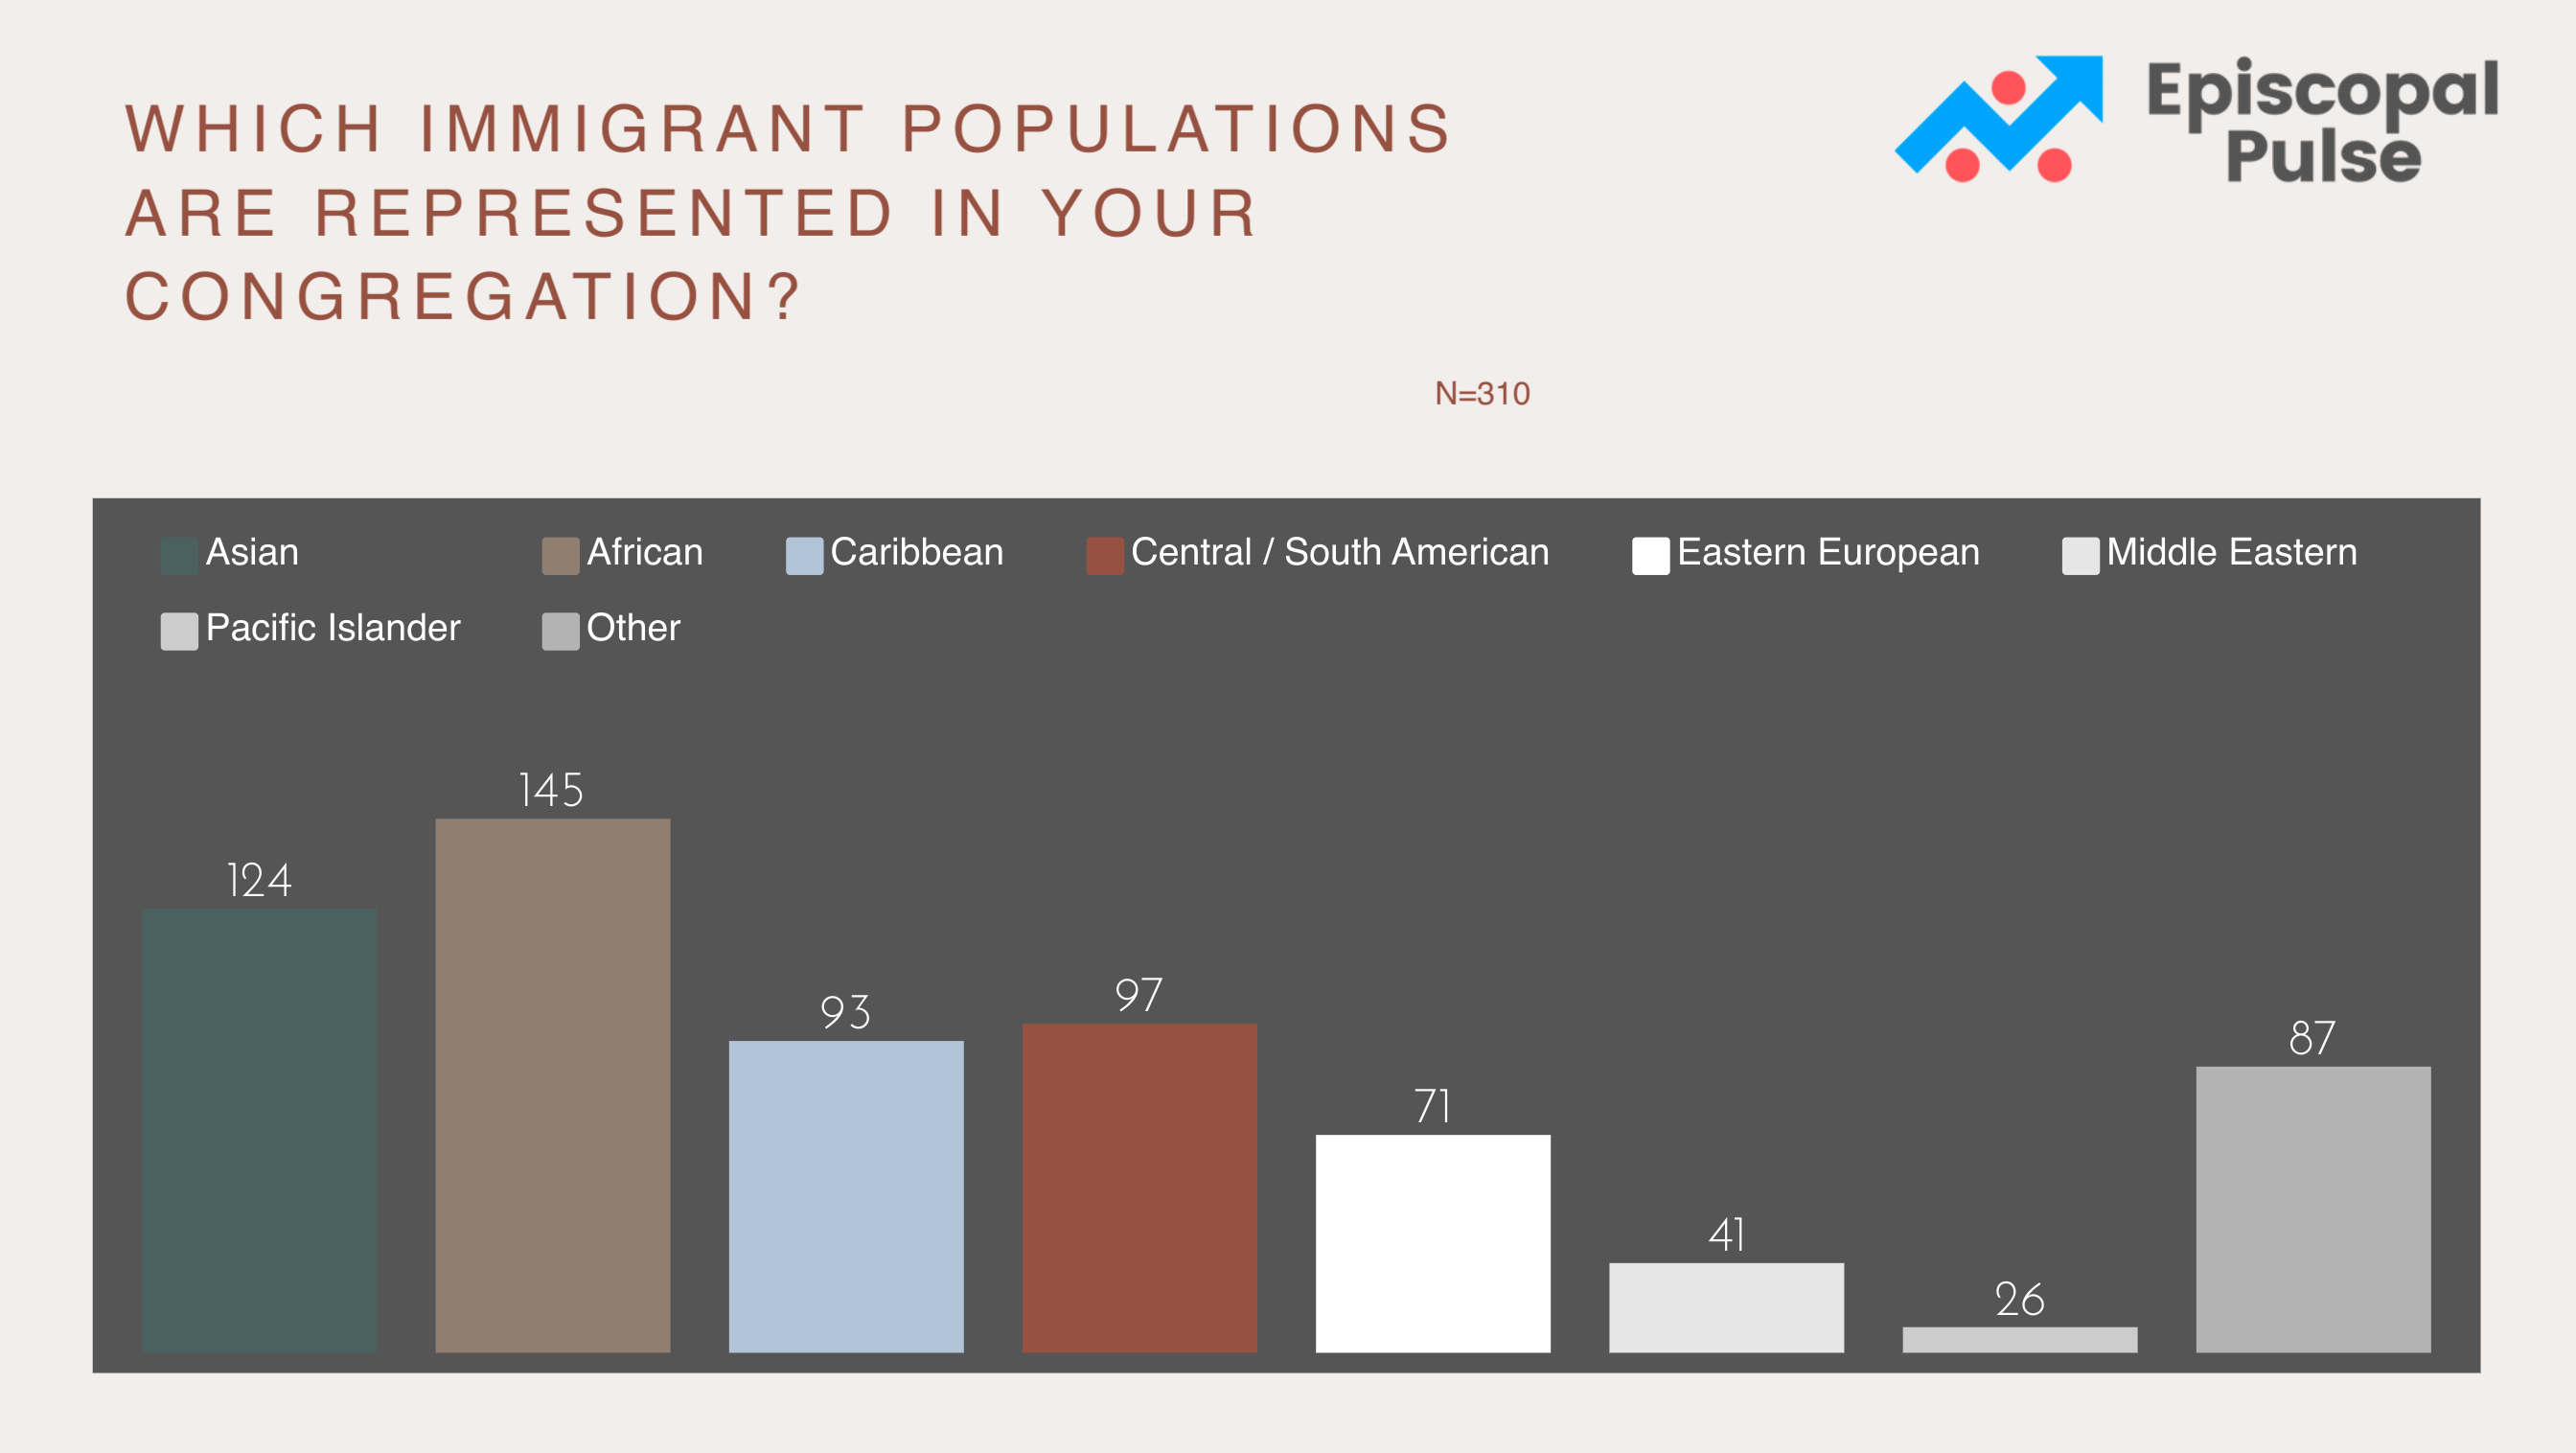
Question: Which immigrant populations are represented in your congregation?
Responses: Asian: 124 | African: 145 | Caribbean: 93 | Central or South American: 97 | Eastern European: 71 | Middle Eastern: 41 | Pacific Islander: 26 | Other: 87
Survey 16: Hidden Opportunities
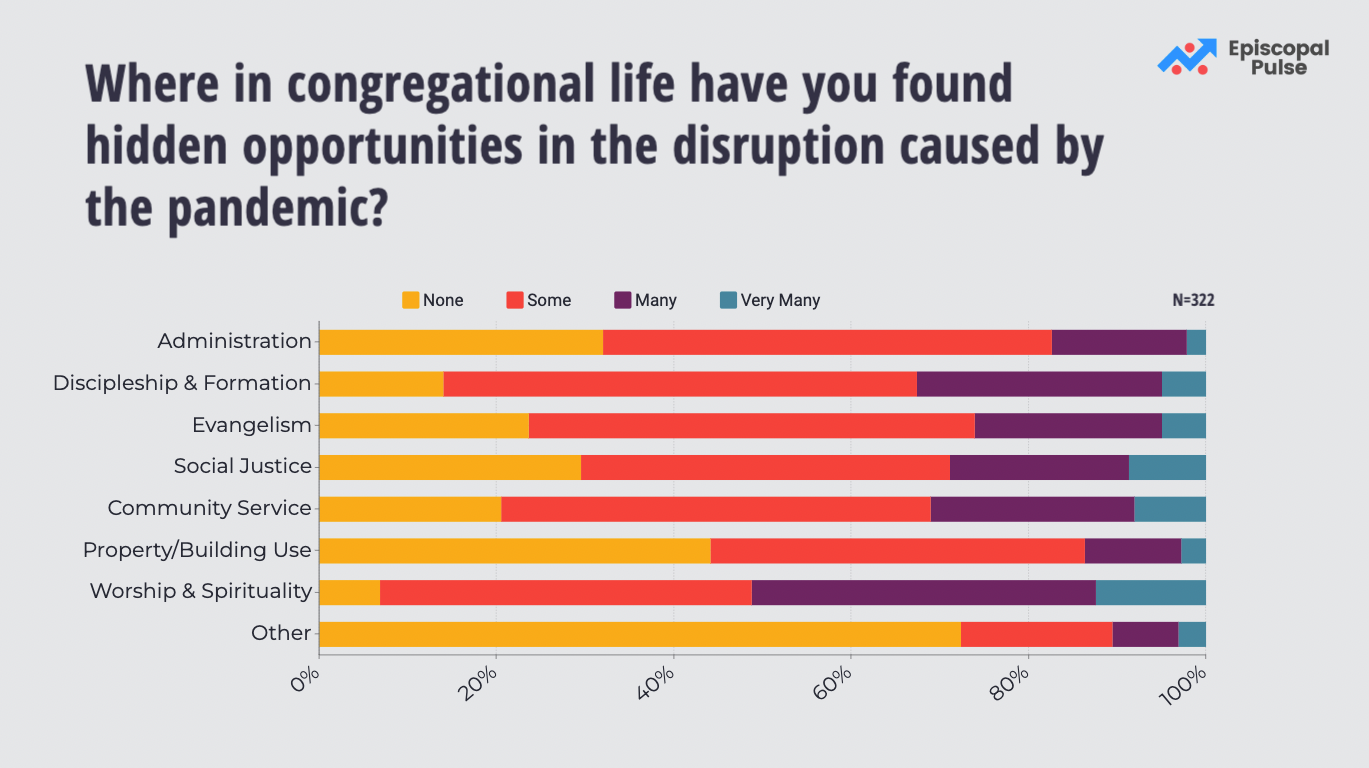
Click the image below to open in your browser and zoom in. Explanatory text follows the images below.
Question: Where in congregational life have you found hidden opportunities in the disruption caused by the pandemic?
Administration: None: 103 | Some: 163 | Many: 49 | Very Many: 7
Discipleship & Formation: None: 45 | Some: 172 | Many: 89 | Very Many: 16
Evangelism: None: 76 | Some: 162 | Many: 68 | Very Many: 16
Outreach - Social Justice: None: 95 | Some: 134 | Many: 65 | Very Many: 28
Outreach - Community Service & Partnerships: None: 66 | Some: 156 | Many: 74 | Very Many: 26
Property/Building Use: None: 142 | Some: 136 | Many: 35 | Very Many: 9
Worship & Spirituality: None: 22 | Some: 135 | Many: 125 | Very Many: 40
Other: None: 233 | Some: 55 | Many: 24 | Very Many: 10
Survey 15: Young Adults
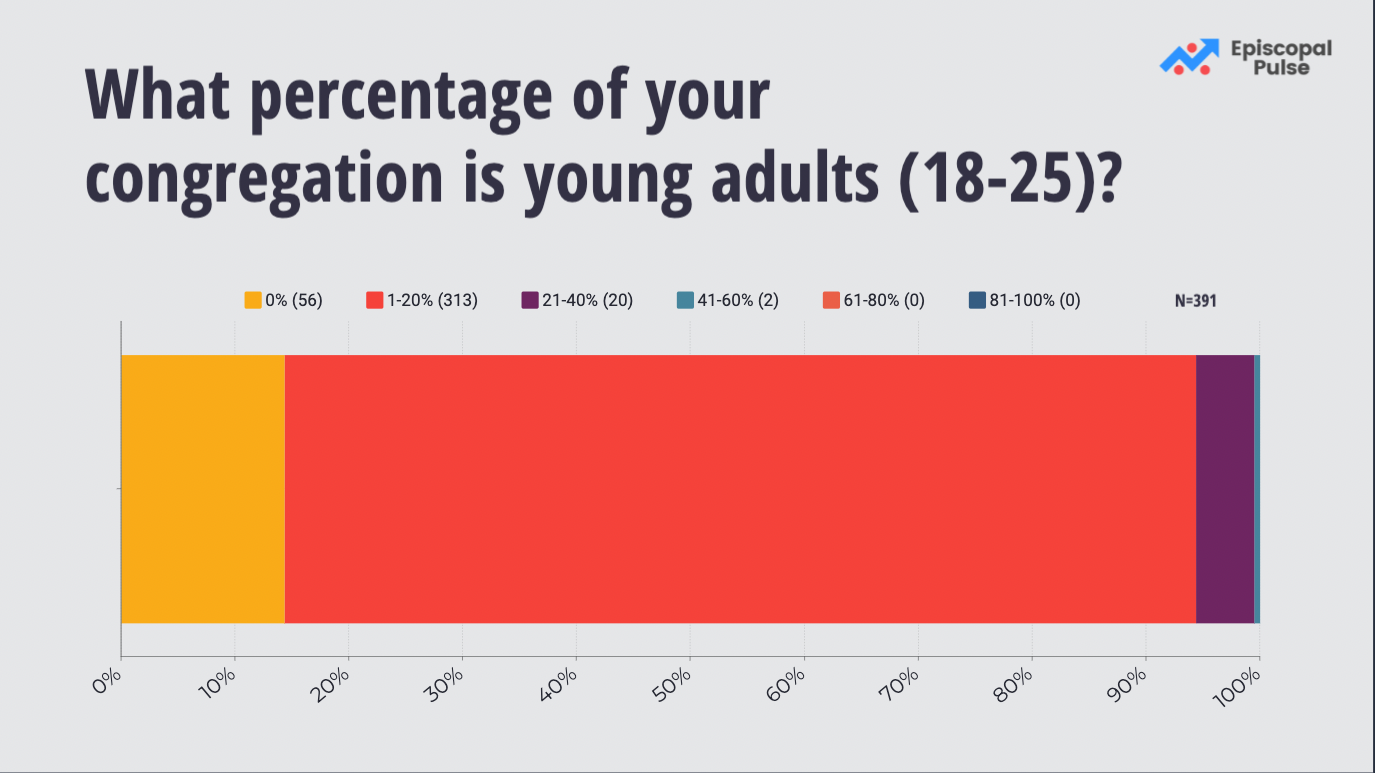
Click the image below to open in your browser and zoom in. Explanatory text follows the images below.
Click the image above to open in your browser and zoom in.
Question: What percentage of your congregation is young adults (18-25)?
0%: 56 | 1-20%: 313 | 21-40%: 20 | 41-60%: 2 | 61-80%: 0 | 81-100%: 0
Key Insights:
- A large percentage of our congregations are missing an entire age group
Survey 14: Let's Learn About...
Click the image below to open in your browser and zoom in. Explanatory text follows the image below.

Question: Which topics/issues do you/your congregants want to learn more about?
Responses:
- Spiritual Practices & Tools: 294
- Bible: 286
- Racial/Ethnic Reconciliation: 233
- Sharing Your Faith: 213
- Episcopal Tradition: 209
- Theology: 205
- Systemic/Structural Racism: 189
- Episcopal Doctrine: 167
- Church Leadership: 94
- Other: 49
Key Insights:
- Spiritual Practices & Tools edged out Bible 294 to 286.
- People seemed least interested in learning more about Episcopal Doctrine (167) and Church Leadership (94).
For Reflection
- Which of these results confirm your perceptions?
- Which of these results surprise you?
Survey 13: Faith and Society
Click the image below to open in your browser and zoom in. Explanatory text follows the image below.
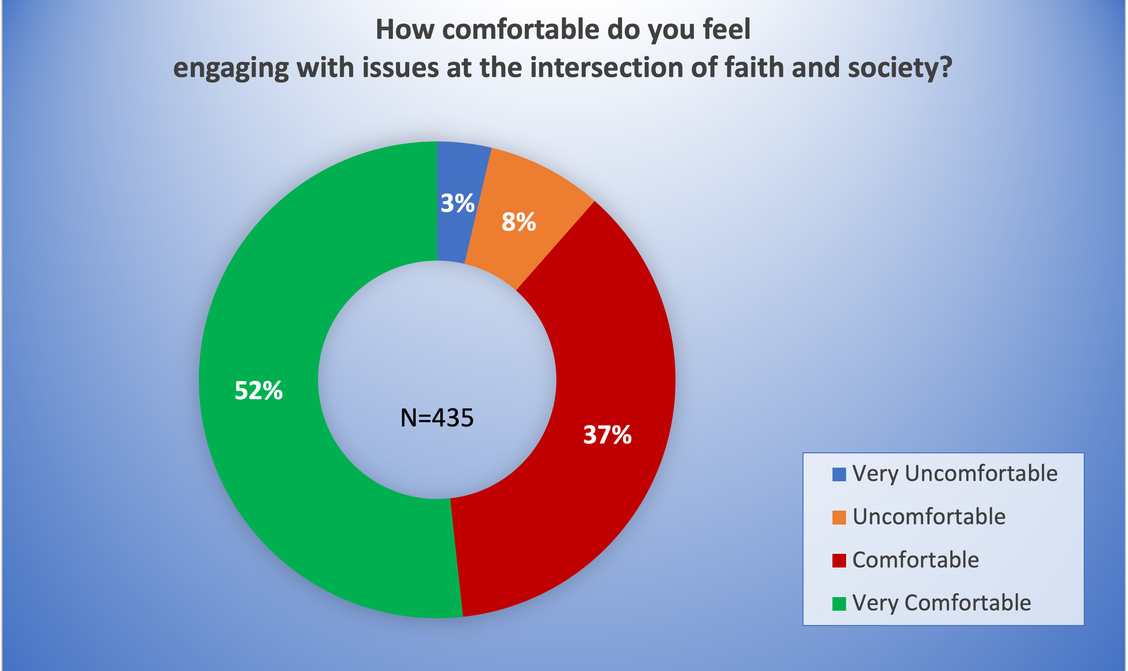
Question: How comfortable do you feel engaging with issues at the intersection of faith and society?
Responses:
- Very Comfortable = 52%
- Comfortable = 37
- Uncomfortable = 8%
- Very Uncomfortable = 3%
- N=435
Key Insights:
- 89% responded “Very Comfortable” (52%) or “Comfortable” (37%)
- 11% responded “Uncomfortable” (8%) or “Very Uncomfortable” (3%)
- If accurate, this speaks to a widespread comfortability in engaging the intersection of Faith and Society. Does also mean they are not afraid of conflict?
For Reflection
- Which of these results confirm your perceptions?
- Which of these results surprise you?
Survey 12: Easter Vigil
Click the image below to open in your browser and zoom in. Explanatory text follows the image below.
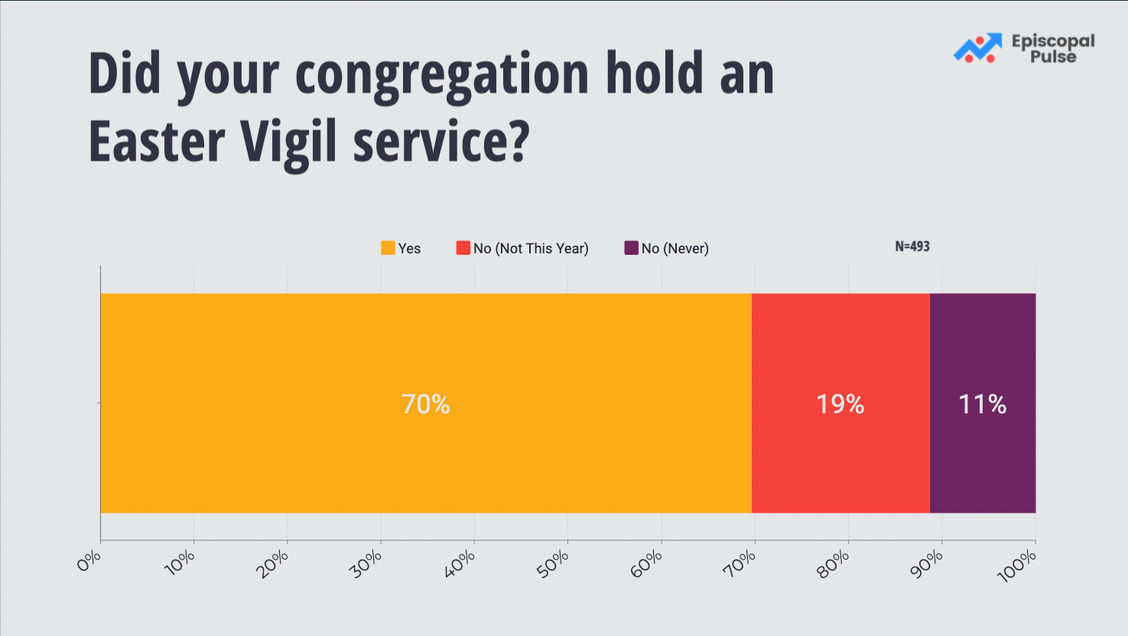
Question: Did your congregation hold an Easter Vigil this year?
Responses:
- Yes = 70% (we held an Easter Vigil this year)
- No = 19% (we did not hold an Easter Vigil this year)
- Never = 11% (we never hold an Easter Vigil)
Key Insights:
- Nearly One-in Five congregations did not hold an Easter Vigil this year.
- It would appear that even now Covid is changing the way we worship.
Survey 11: Easter Questions
Microsurvey #11 asked asked three Easter-related questions
-
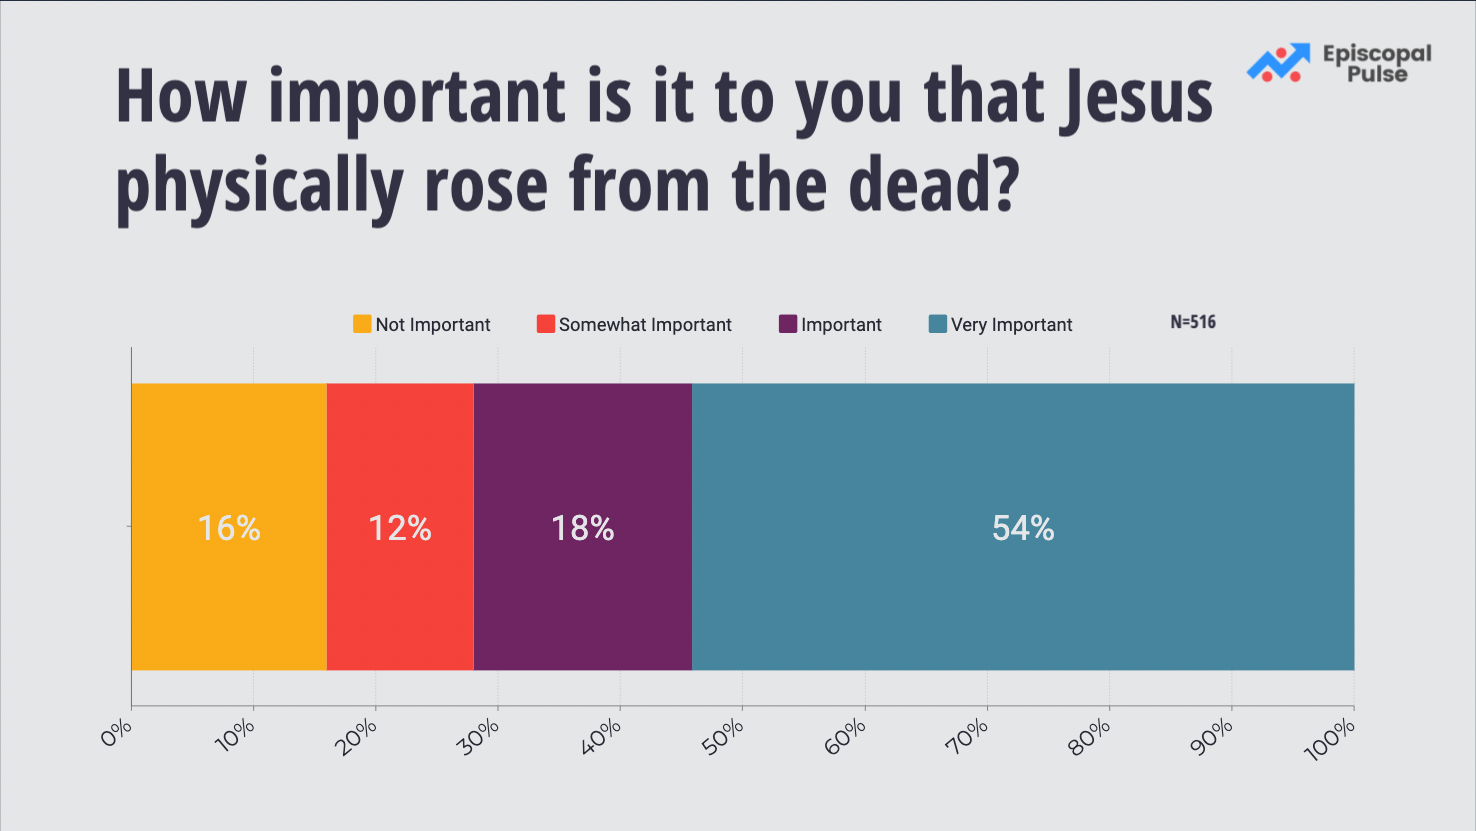
How important is it to you that Jesus physically rose from the dead?
-
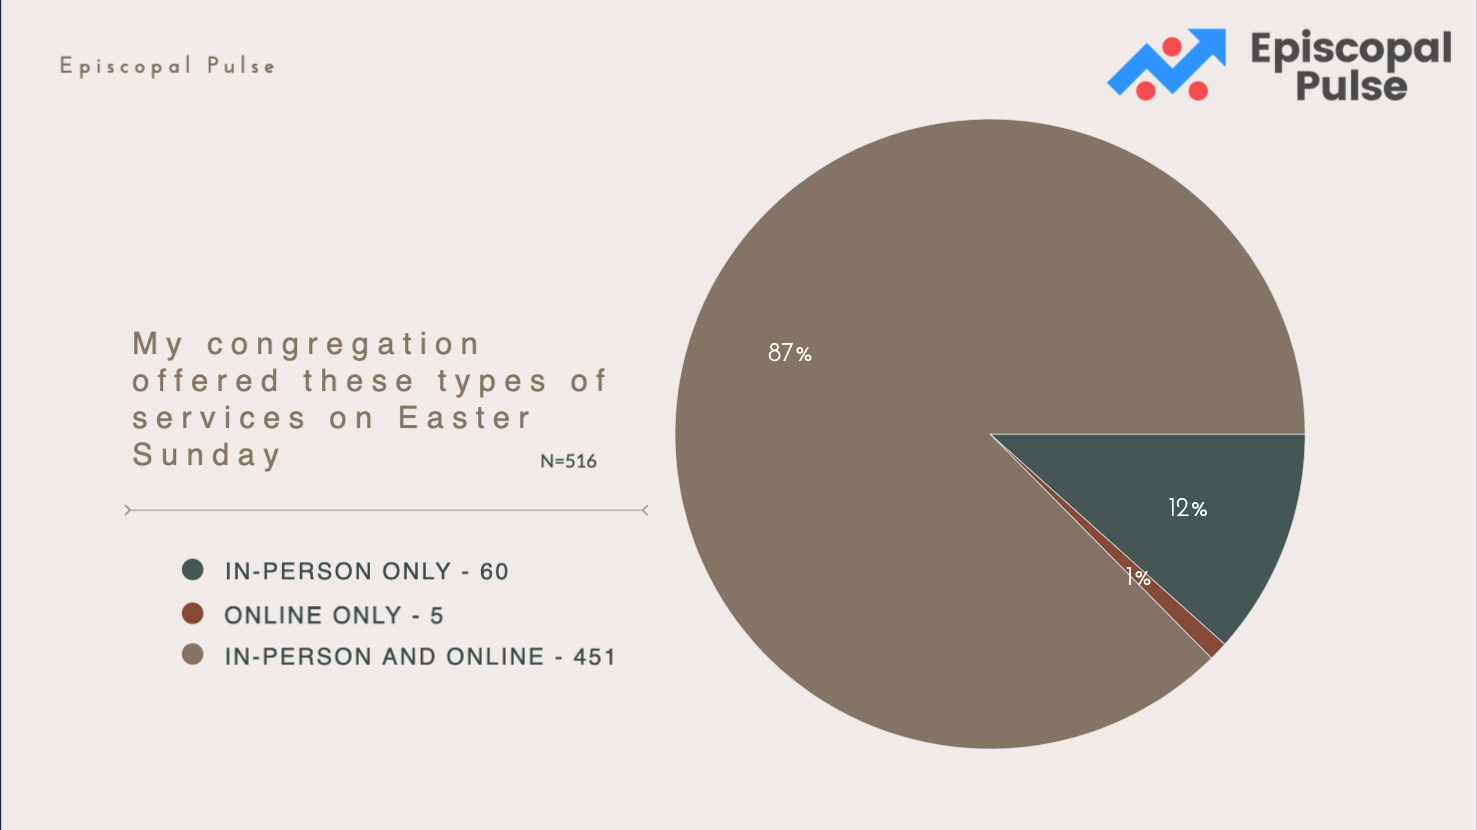
What types of services is your congregation offering on Easter Sunday?
- What strategies your congregation is undertaking to bring new people to your church on Easter Sunday?
Question 1: How important is it to you that Jesus physically rose from the dead?
Answers: (N=516)
- Very Important: 279
- Important: 92
- Not Important: 82
- Somewhat Important: 62
Question 2: What types of services is your congregation offering on Easter Sunday?
Answers: (N=516)
- In-Person Only: 61
- Online Only: 5
- Both In-Person and Online: 451

Question 3: What strategies your congregation is undertaking to bring new people to your church on Easter Sunday?
Answers: (N=466)
-
Facebook Posts (Unpaid): 390
-
Roadside Signage: 159
-
Newspaper Ads: 89
-
Instagram Posts or Stories: 87
-
Boosted Facebook Posts or Ads: 79
-
Mass Mailings: 62
-
Instagram Ads: 14
-
Bumper Stickers: 11
-
Google Ads: 10
-
Radio Ads: 8
-
Tweets: 31
-
Twitter Ads: 6
-
TikTok Posts: 3
-
TikTok Ads: 2
-
TV Ads: 1
- Other: Email, Phone Calls, Press Releases, Website, Hand-Written Notes, Newsletter, Baptisms, Face-to-Face, Promise of Mimosas
Survey 10: Vitality
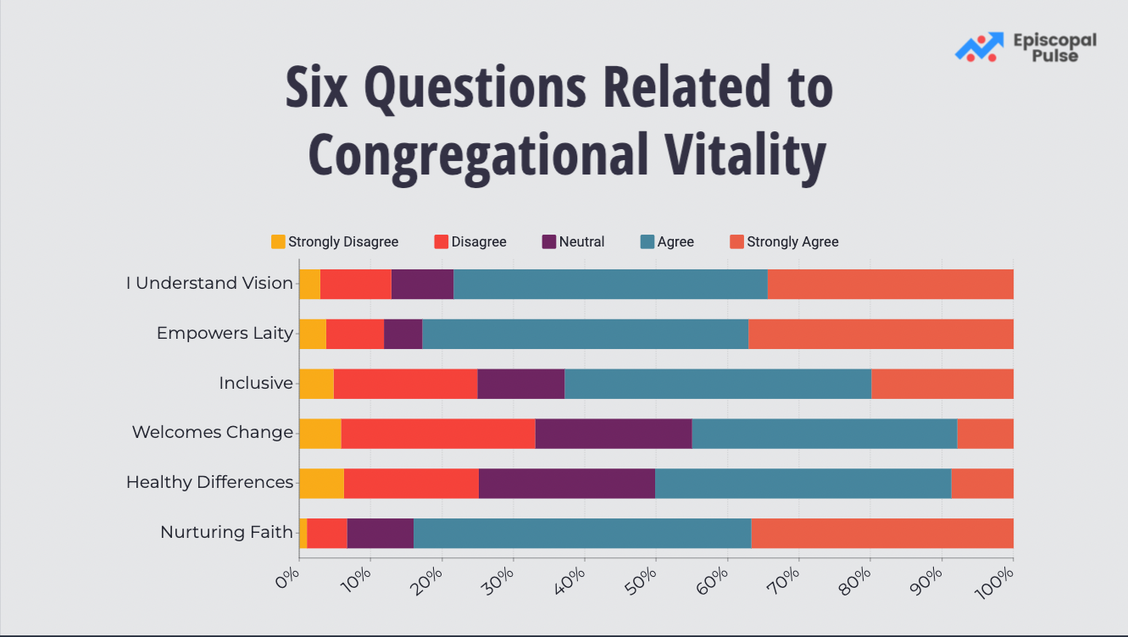
Microsurvey #10 asked asked questions about six indicators of you congregation’s vitality (Strongly Disagree <—> Strongly Agree). These areas were:
- Understanding congregation’s vision and mission | Strongly Disagree: 14 | Disagree: 48 | Neutral / No Opinion: 42 | Agree: 212 | Strongly Agree: 166
- Empowering laity | Strongly Disagree: 18 | Disagree: 39 | Neutral / No Opinion: 26 | Agree: 220 | Strongly Agree: 179
- Inclusion | Strongly Disagree: 23 | Disagree: 97 | Neutral / No Opinion: 59 | Agree: 207 | Strongly Agree: 96
- Welcoming change | Strongly Disagree: 28 | Disagree: 131 | Neutral / No Opinion: 106 | Agree: 179 | Strongly Agree: 38
- Working out differences in a healthy way | Strongly Disagree: 30 | Disagree: 91 | Neutral / No Opinion: 119 | Agree: 200 | Strongly Agree: 42
- Nurturing faith | Strongly Disagree: 5 | Disagree: 27 | Neutral / No Opinion: 45 | Agree: 228 | Strongly Agree: 177
Key Insights:
Looking at the results with the understanding that Agree and Strongly Agree are positive indicators of vitality and Neutral or below are negative indicators…
Episcopal congregations’ most positive vitality indicators are: “Nurturing Faith” followed by “Empowering Laity”
Episcopal congregations’ most negative vitality indicators are: “Welcoming Change” followed by “Working Out Differences in a healthy way.”
Survey 9: Bible Study
Survey 8: Collaborate
Do We Collaborate?
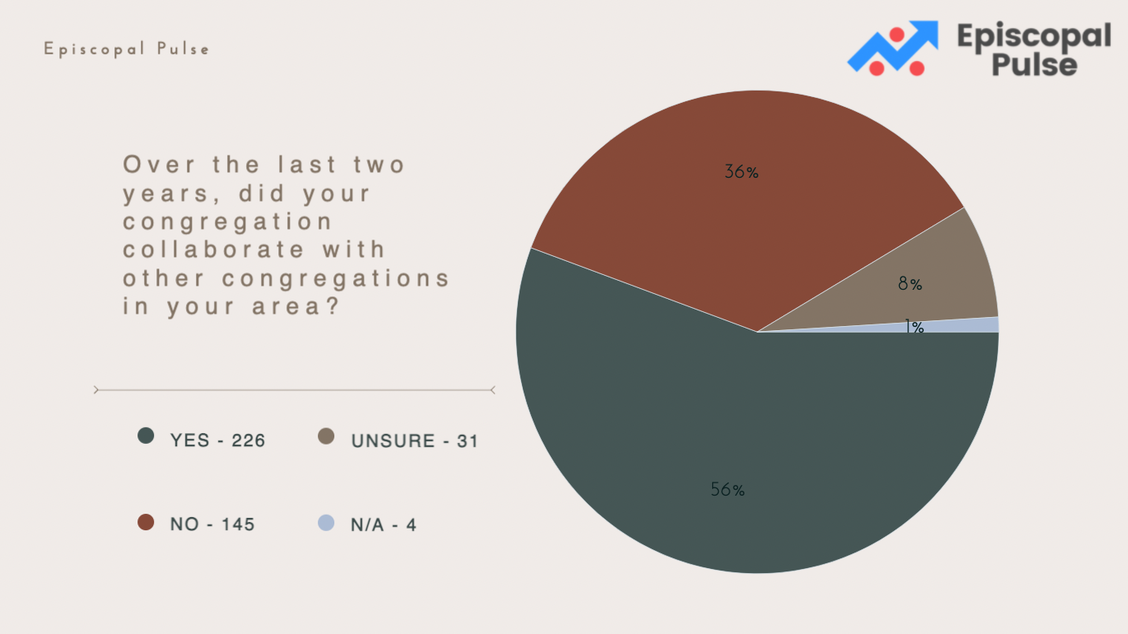
- Did your congregation collaborate with others – Yes: 226, No: 144, Unsure: 31, Not Applicable: 4.
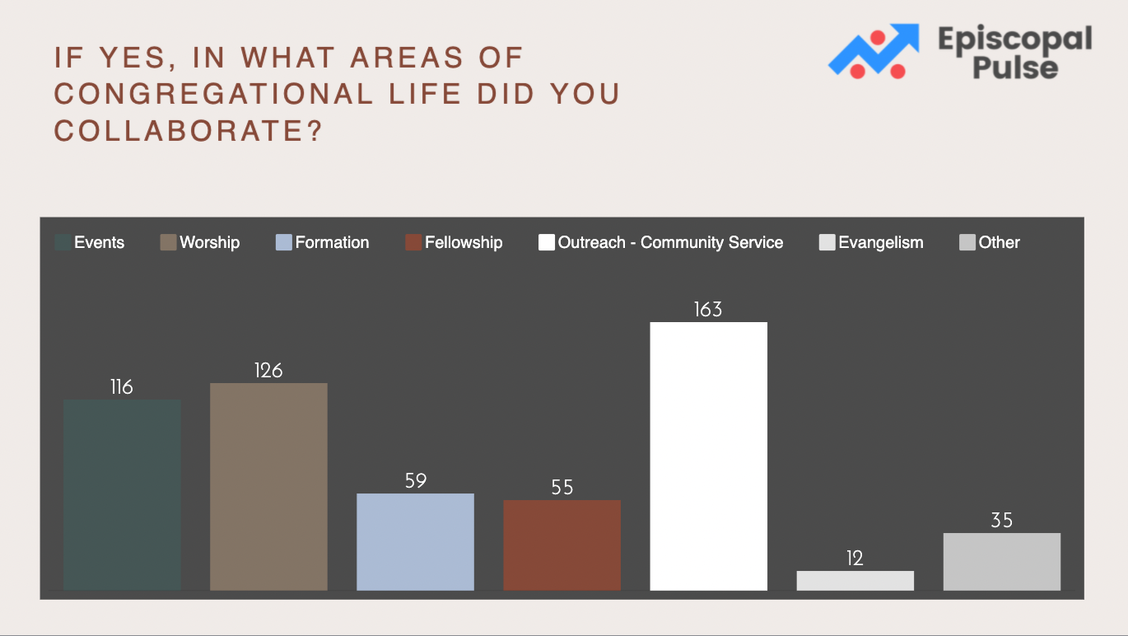
- If yes, in what areas – Outreach: 66, Worship: 126, Events: 116, Formation: 59, Fellowship: 55, Other: 35, Evangelism: 12.
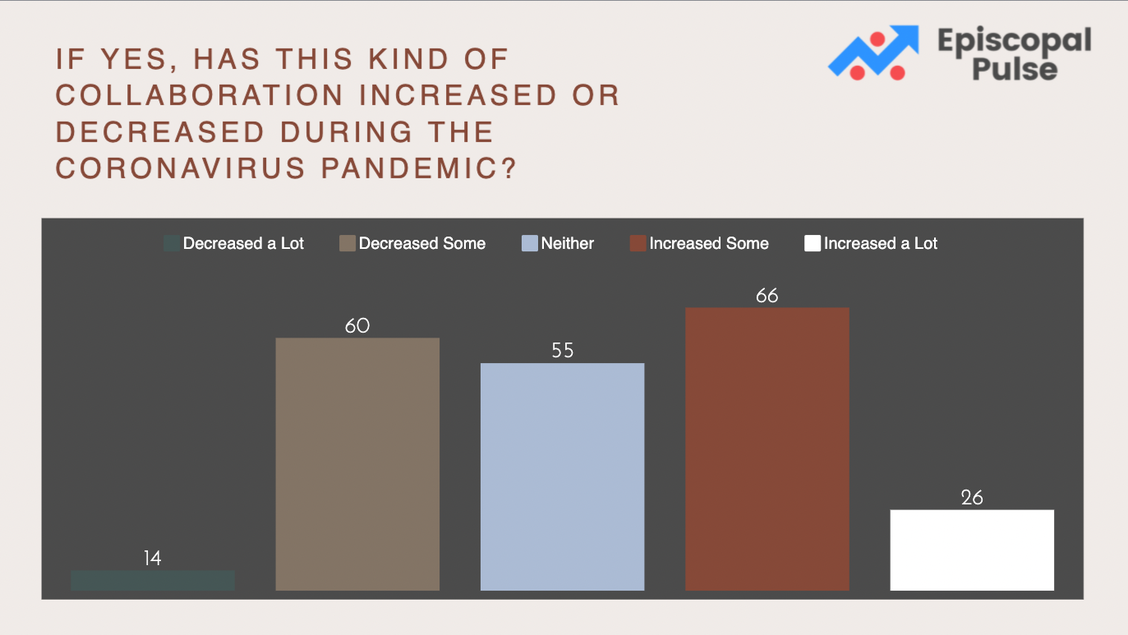
- If yes, has collaboration increased or decreased – Increased Somewhat: 66, Decreased Somewhat: 60, No Change: 55 Increased a Lot: 26
Survey 7: Social and Racial Justice
Survey 6: Covid Toll
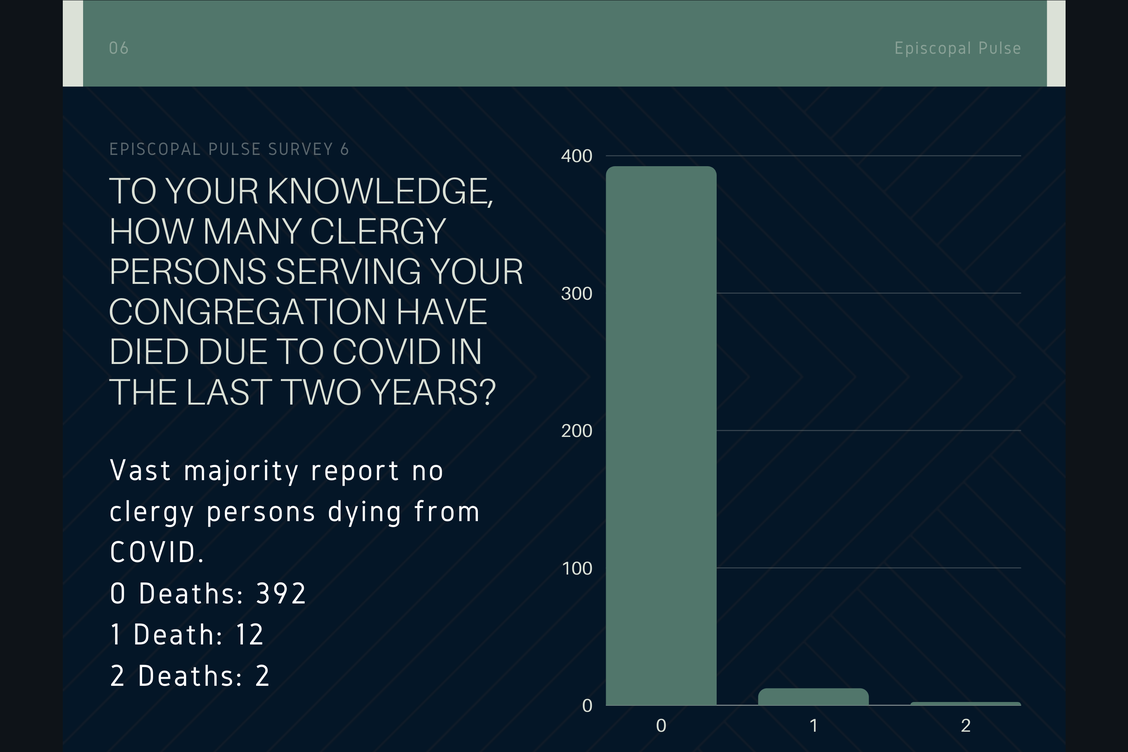
Question 1: To your knowledge, how many clergy persons serving your congregation have died due to Covid in the last two years?
Responses: 0: 392 | 1: 12 | 2: 2 | 3: 0 | 4: 0 | 5 or more: 0
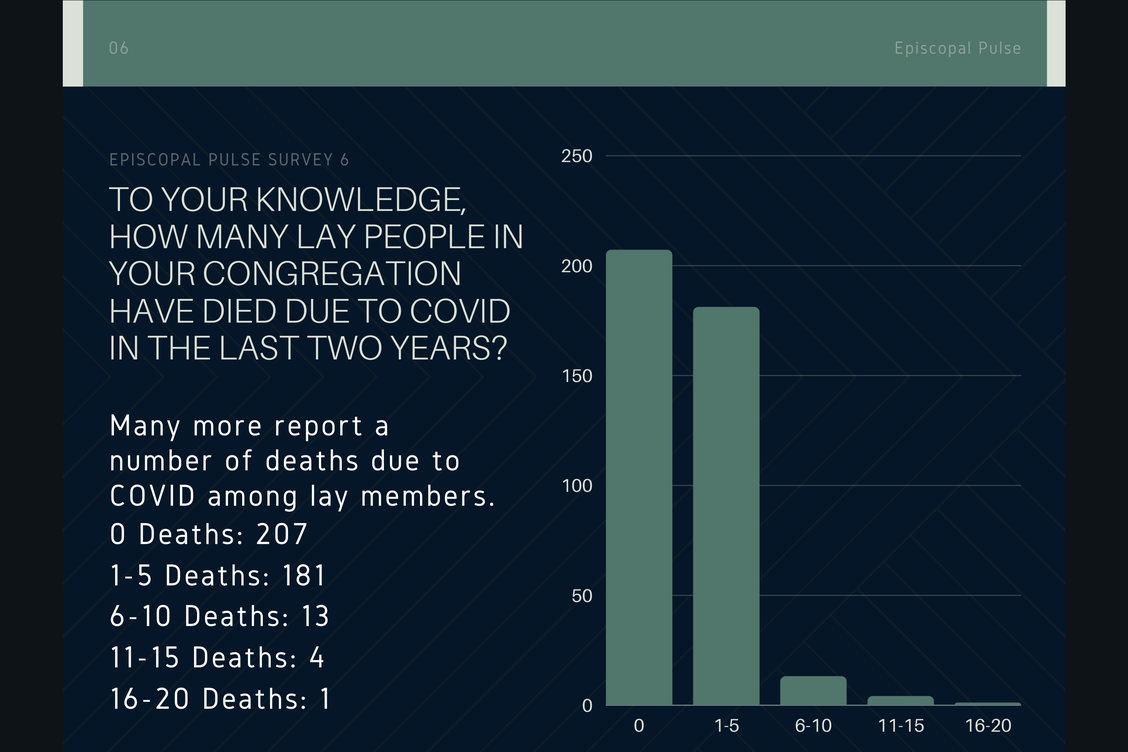
Question 2: To your knowledge, how many lay people in your congregation have died due to Covid in the last two years?
Responses: 0: 207 | 1-5: 181 | 6-10: 13 | 11-15: 4 | 16-20: 1 | 21 or more: 0
Survey 5: Buildings
Survey 4: Demographics
Question: How closely does the demographic make up of your congregation reflect the demographic make up of your wider community?
Responses:
- Many population segments missing or underrepresented: 226
- Some population segments missing or underrepresented: 290
- No populations segments missing or underrepresented: 27
- Don't know: 0
N=543
Survey 3: Who's Back?
Question: In-Person Worship: What percentage of your pre-Covid average in-person Sunday attendance do you expect to return to in-person worship post-pandemic?
Responses:
- 0-25%: 11
- 26-50%: 68
- 51-75%: 199
- 76-100%: 236
- 101-125%: 43
- 126-150%: 0
- More than 150%: 2
N=559
Question: Online Worship: What percentage of your current average online Sunday attendance do you expect to continue to worship online post-pandemic?
Responses:
- 0-25%: 295
- 26-50%: 138
- 51-75%: 64
- 76-100%: 53
- 101-125%: 9
- 126-150%: 0
- More than 150%: 0
N=559
Survey 2: Nothing to See Here!
This survey was repurposed for Survey #3 after a technical issue.
Survey 1: Flourishing or Struggling?
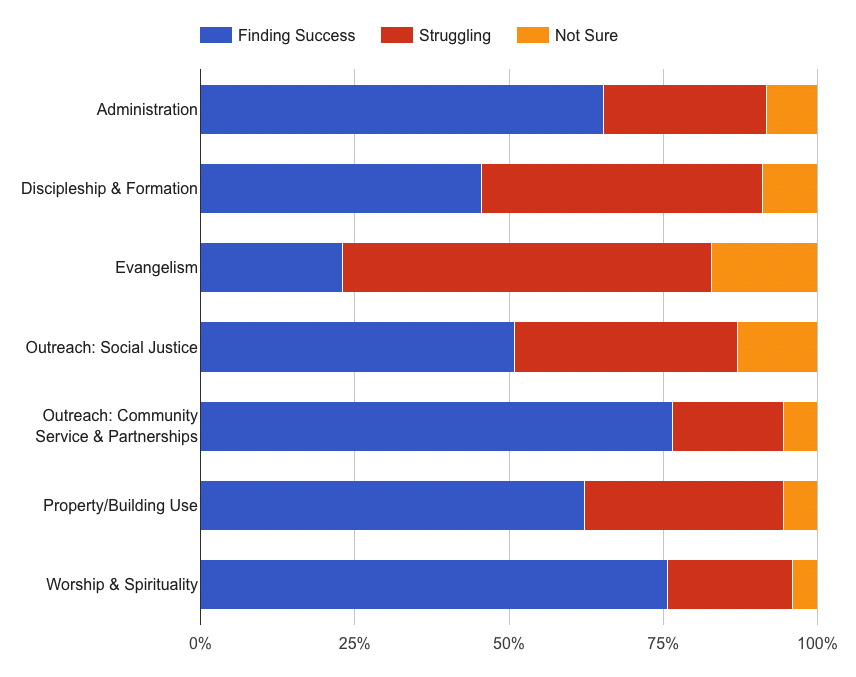
In your view, in each of the following areas of congregational life, is your congregation finding success or struggling? (N=652)
- Administration: Finding Success: 426 | Struggling: 172 | Not Sure: 54
- Discipleship & Formation: Finding Success: 297 | Struggling: 297 | Not Sure: 58
- Evangelism: Finding Success: 150 | Struggling: 390 | Not Sure: 112
- Outreach - Social Justice: Finding Success: 332 | Struggling: 235 | Not Sure: 85
- Outreach - Community Service & Partnerships: Finding Success: 499 | Struggling: 117 | Not Sure: 36
- Property/Building Use: Finding Success: 406 | Struggling: 210 | Not Sure: 36
- Worship & Spirituality: Finding Success: 493 | Struggling: 133 | Not Sure: 26
